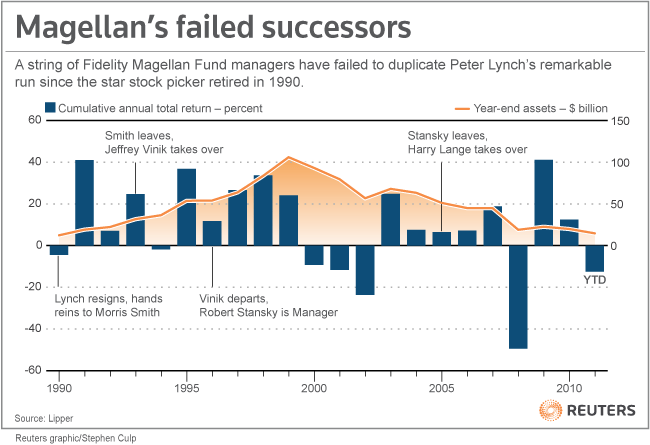
For those who do not know (I doubt there will be many), Peter Lynch is one of the most successful fund managers of all time.
He managed a fund called Magellan at US Investment Giant Fidelity Investments and during his 13 yr tenure, he delivered an average CAGR of 29.2%.
Sadly the fund couldn't keep up post Lynch's retirement and his successors weren't able to keep up with his returns.
That's how good Lynch was!
In 1989, a year before retirement, Lynch wrote and published a book called 'One Up on Wall Street'.
Almost 32 years later, the teachings of the book remain relevant.
(Highly recommended read)
Chapter 7 of the Book Titled
"I've Got It, I've Got It - What is It?"
talks about the need to classify stocks.
Peter's argument is that you need to know what kind of stock you hold in your portfolio.
Not all stocks are the same - and he is right!
Different stocks posses different characteristics and its these characteristics of a company that ultimately determine the return expectation and actual returns on the stock over a long term.
Very important to know what kind of a stock you own!
Here is how Lynch has classified each stock into six broad categories.
1. The Slow Growers
These are large and aging companies that barely manage to grow slightly faster than the average GDP growth of an economy.
Slow Growers pay a generous and hefty dividend but their sales and earnings aren't going anywhere
These stocks are equivalent to Snails
Slow Growers didn't start out that way.
They were once fast growers in their industry but ultimately consolidated a large market share.
Because their industry doesn't grow by very much, these companies do not grow and as such their stock doesn't move by a lot.
Here is one example of an Indian Company that's a slow grower to almost a no grower now.
If you look at the characteristics of Castrol, you will notice
1⃣ It has negligible Sales Growth
2⃣ It pays a hefty percentage of its profits as Dividends
3⃣ It controls a large percentage of its market share in the Industry it operates in.
Pays High Percentage of Profits as Dividends
This is what Castrol stock price has done over the last 10 years.
So if you own a slow grower in your portfolio and expect it to deliver 25% CAGR, then you do not know what you own and don't have the right expectations from the stock.
2. The Stalwarts
These are large companies that are growing slightly faster than GDP of an economy.
These stocks are equivalent to Turtles.
They can swim faster than a snail can crawl.
Stalwarts can be characterized by
1⃣ Large Market Share of their Products
2⃣ Steady Earnings and Sales Growth
3⃣ Earnings aren't cyclical and do not suffer under tough times
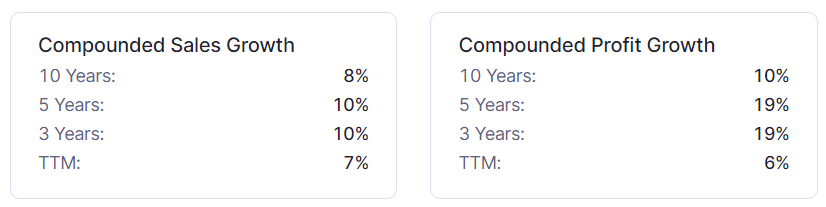
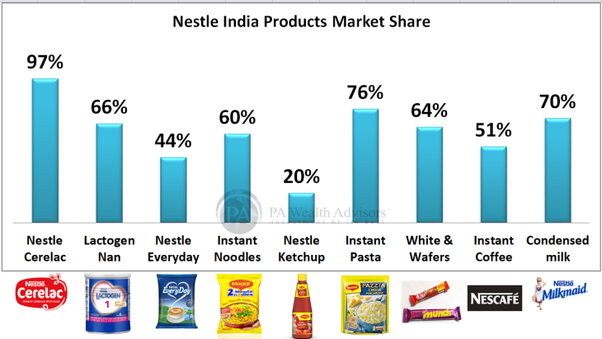
An example of Stalwart from Indian context is Nestle India.
Both 10 year earnings and sales have growth slightly faster than growth Indian Economy.
It has a Large Market Share in each of its products
And its earnings aren't cyclical .
This is what Nestle's stock has done since 2015.
139% Return over ~6 Years
A CAGR of around 13.26%, slightly higher than Indian economy.
Another key characteristic of Stalwarts is that they do not have severe drawdowns during time of crisis.
If you observe the chart of Nestle during Covid crisis, you will observe the stock had drawdown of about ~20% compared to almost ~40% in Nifty.
This is the reason why Stalwarts get all the love during crisis. Most cash is chasing them during recessions.
Stalwarts can double or triple over decades but they cannot become 10 baggers or give you a 25% CAGR.
So if you own a Nestle in your portfolio with the expectation that it will give you consistent 25% annual returns then you do not know what you own.
Stalwarts are suited for retirement portfolios, the ones which expect steady 10% annual returns and regular incomes in the form of high dividends.
If you have high allocation to high risk mid and small cap names, small allocation towards stalwarts can also help you reduce the overall risk and occurrence of hefty drawdowns in your portfolio.
3. The Fast Growers
These are companies that are growing their earnings and sales by more than 25% per year
This is where you will find multibaggers of tomorrow
Stocks in this category are like tigers and cheetahs of the investment world, they move fast and conquer territories
Characteristics of Fast Growers are as follows
1⃣ Aggressively Gaining Market Share in the Industry
2⃣ Sales and Earnings Growth of more than 25%
3⃣ High Investments into their Own Business to increase product lines
Fast Growers are volatile and earnings do not move steadily but by leaps and bounds.
Some Quarters Earnings may not grow at all while in others they will double.
You do not have to find Fast Growers in emerging and exciting industries, you can find them even in dull and boring industries.
The only condition is that the company should be gaining market share faster than the dull and boring industry is able to grow.
Here is an example of my favorite Fast Grower - Laurus Labs.
In the last 5 years, Laurus has grown its sales by more than 22% CAGR and its Earnings at 49% CAGR.
Laurus also shows other traits of fast growers.
It is reinvesting back into its business and getting into newer products - Formulations, Synthesis, CDMO, BioTech.
If you had to find this early, you just had to look at its CAPEX to know its a fast grower.
Just like a Fast Grower, its earnings too have been lumpy.
2015 witnessed a decrease, then a double by 2017, then a decrease again till 2019 and then a 4x increase.
This is what Laurus's stock has done since listing.
A six bagger so far.
There is usually a lot of noise around Fast Growers, but if you focus on the noise and not the elements that make the company a Fast Grower, you will probably miss the boat
If you have stocks like Laurus in your portfolio and expect steady returns without severe drawdowns then you do not know the type of stock you own and have incorrect expectations from it
These stocks do not move steadily like Stalwarts & are not suited for retirement portfolios.
4. The Cyclicals
Cyclicals are companies whose sales & profits rise & fall regularly with market cycles.
These are your autos, cement, steel and metal companies.
I nominate lemurs as the animal to denote Cyclicals.
(Lemurs hibernate for upto 7 months in a year)
Characteristics of Cyclical include:
1⃣ Cyclicality in Sales and Earnings
2⃣ Established Market Share
3⃣ Negligible Reinvestments into their Own Business during down cycles
You have to be very well versed with the industry and know the industry structure like back of your hand to make money in cyclicals.
Enter during the peak and you can lose upto 80% of your capital or more without seeing any return for many years.
However, if you get the cycle right, you can make equally wild gains and many times your money.
By definition, cyclicals are not consistent compounders and all investments should have a exit strategy well thought of before entry.
Some examples include, SAIL, Hero Motors, DLF.
Here is a chart for SAIL, the cyclicality in stock is clearly visible.
These stocks aren't suited for those who have no knowledge of the industry or who are looking for consistent 25% CAGR over a decade or more.
Note: Cyclicals can also be Fast Growers.
This is when a cyclical is gaining market share in the industry and able to keep its Balance Sheet intact.
Shree Cement for example has given 100x returns in last 12 or so years, but that return came at occasional 30% or more drawdowns.
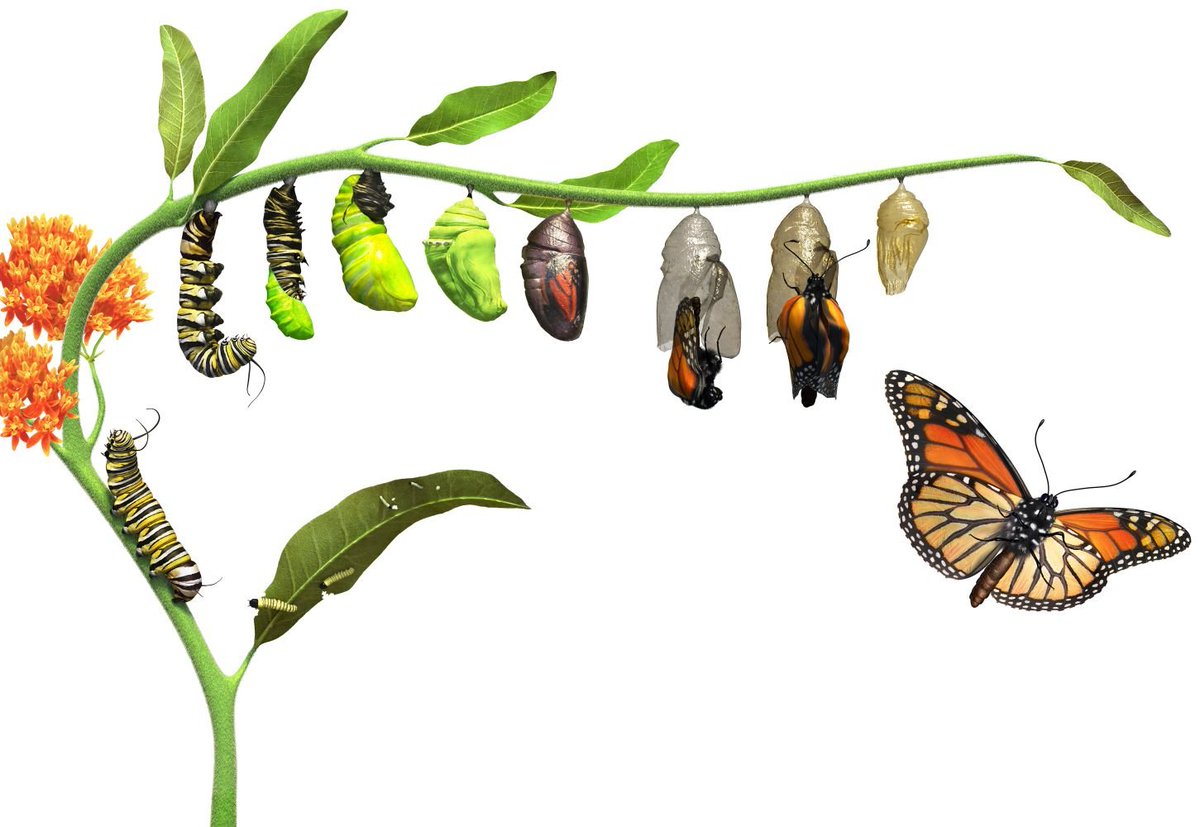
5. The Turnarounds
These are companies that have went through bankruptcy and once were a gruesome business. They are transforming themselves into a better business that is finally paying off results.
Kinda like caterpillar to butterfly transformation.
Characteristics of Turnaround include:
1⃣ Once a Depressed Bankrupt Business
2⃣ Transforming itself from old bankrupt business
3⃣ Financials stabilizing and sales and earnings increasing
My favorite example of a Turnaround in Indian context is RACL Gear Tech.
This was a business that was neglected by its owners and made its way to bankruptcy until it was rescued by an employee and now is a growing export oriented business finding legs to become a fast grower.
If you look at RACL's chart, you will notice the stock was highly volatile and didn't do anything from 2004 to 2016 .
From 2016 onwards however, as earnings improved and business stabilized, the stock started performing and is a 13 bagger.
You will notice this in RACL financial metrics as well, the return ratios for shorter durations are higher than return ratios for longer durations.
Turnarounds can be extremely lucrative esp. if they show signs of becoming fast growers after a turnaround.
The earnings and stock performance will likely be very volatile, so if you own turnarounds in your portfolio and expect them not to face 50%+ drawdowns during tough times, then you do not know the type of stock you own.
6. Asset Plays
These are companies that own some asset that is valued higher than the total market cap of the company.
Essentially you can buy the entire company, strip its assets into piecemeals, sell them and earn more than what you paid to buy the company.
Characteristics of Asset Plays include:
1⃣ Market Cap Less than Sum of its Assets
2⃣ No growth in Sales and Earnings
3⃣ Main Business is stagnant
An Example of an Asset Play in Indian context is Bombay Dyeing.
Bombay Dyeing as a company is gruesome cash losing business.
This is pretty evident from its sales and earnings growth metrics.
The company however owns a residential project with 270 units yet to be sold. The total estimated value of this inventory is about 2100 crores, slightly above its current market cap.
If you look at the chart of Bombay Dyeing, you will see the stock hasn't done anything since listing.
I wonder if the 42% Public Shareholders know what type of stock they hold in their portfolios.
So those were the six categories of stocks as defined by Peter Lynch.
Now let's answer a question - How to decide how much runway for growth a company has?
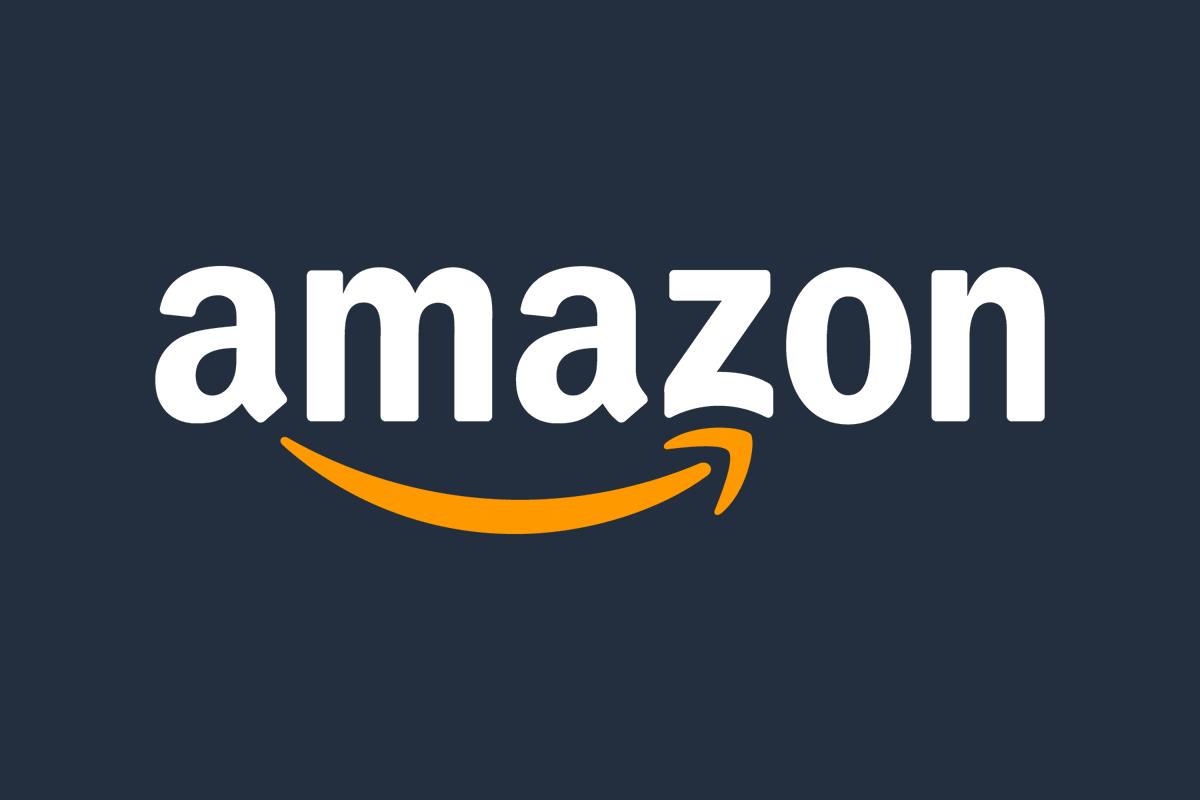
No company can become larger than the economy it operates in. Take for example Amazon.
$AMZN has a market cap of about $1.8 Trillion.
US Economy GDP is about $18 Trillion.
A 10x increase for Amazon means it will be bigger than US Economy, there is a very negligible chance of this happening.
So if the market cap of the business cannot multiply by 10x, how will your stock return?
Expecting a 10x return on $AMZN from here is foolish.
However, if Amazon were to demerge its various businesses and list them separately as independent units, then you can expect multibagger return on smaller businesses of Amazon.
The current anti-trust lawsuit investigations against Big Tech in US is actually good for them.
If they end up breaking the business, the shareholders are in for huge rewards over time.
The same situation played out when Standard Oil was dismantled after anti trust lawsuit against it by then US President Teddy Roosevelt's administration.
The breakup of Standard Oil made John D Rockefeller, the richest man in America.
But that's a story for another thread.
So if you own Apple, Amazon, Microsoft and expect them to deliver returns like they have over the last decade without a demerger of their business in your investment thesis then you do not know the type of stock you own.
With this, we come to an end of this thread.
I hope this helped you understand the various types of stocks available in market beyond just the usual tags of growth and value.
If you find this thread useful then follow me
@itsTarH I write a new thread every weekend.
All my previous work, can be found here.
https://t.co/az1Rsw05TO
I also teach a class on data visualization, if you're interested
The kind folks at Skillshare have increased the free trial length to 30 days if you sign up using this link
https://t.co/VyPiV7u7pp Releasing new classes on Personal Finance & Investment Research coming weekend
Will resume writing and publishing long form articles at my blog.
The next is a series of articles on Biologics CDMO industry.
Subscribe for free, if you're interested.
Thank you to the 1500+ of you who already have!
https://t.co/6tHU5fQXGu
Thank you for reading, please retweet the first tweet in this thread for a broader reach.
See you all next weekend!