Bollinger Bands
https://t.co/xz36OOLNvQ
Thread: Bollinger Bands
— Prashant Shah (@Prashantshah267) August 22, 2020
Bollinger Bands\xae is a wonderful invention of John Bollinger. #Bollingerbands #Indicators #Definedge pic.twitter.com/UREE7eedxh
Thread: Bollinger Bands
— Prashant Shah (@Prashantshah267) August 22, 2020
Bollinger Bands\xae is a wonderful invention of John Bollinger. #Bollingerbands #Indicators #Definedge pic.twitter.com/UREE7eedxh
Thread: Donchian Channels
— Prashant Shah (@Prashantshah267) August 8, 2020
Donchian channels were invented by Richard Donchian. He is known as a father of trend following trading. He was founder of world\u2019s first managed fund in 1949. #donchianchannels #indicators #definedge pic.twitter.com/IaTcGedIbR
Thread: Darvas Box Theory#Darvas #knowledgesharing #Definedge pic.twitter.com/xYRrlkjDrm
— Prashant Shah (@Prashantshah267) July 17, 2020
Thread: MFI Indicator
— Prashant Shah (@Prashantshah267) July 24, 2020
Created by Gene Quong and Avrum Soudack, MFI stands for Money Flow Index. #MFI #Indicators #Definedge pic.twitter.com/zZPU4SUuEu
Thread: Super trend indicator:
— Prashant Shah (@Prashantshah267) June 13, 2020
Developed by Olivier Seban, Super trend is an indicator plotted on the price chart like a moving average. pic.twitter.com/1vMsz399d9
Thread on Relative Strength Index or RSI.
— Prashant Shah (@Prashantshah267) June 20, 2020
Devised by J. Welles Wilder, RSI (Relative Strength Index) is one the most popular indicators in Technical analysis. Let us try to understand the underlying formula and logic behind this indicator. pic.twitter.com/Fhwjm3jeWC
ADX Indicator: Thread
— Prashant Shah (@Prashantshah267) June 8, 2020
You will see three lines, that forms part of the ADX indicator, appearing in the lower pane in the chart below. Let us understand them. pic.twitter.com/yT0kXmfBPS
\U0001d5e0\U0001d602\U0001d5f9\U0001d601\U0001d5f6\U0001d5fd\U0001d5f9\U0001d5f2 \U0001d600\U0001d5f2\U0001d5f0\U0001d601\U0001d5fc\U0001d5ff \U0001d604\U0001d5ee\U0001d601\U0001d5f0\U0001d5f5\U0001d5f9\U0001d5f6\U0001d600\U0001d601 \U0001d5fc\U0001d5fb \U0001d5e7\U0001d5ff\U0001d5ee\U0001d5f1\U0001d5f6\U0001d5fb\U0001d5f4\U0001d603\U0001d5f6\U0001d5f2\U0001d604 \U0001d602\U0001d600\U0001d5f6\U0001d5fb\U0001d5f4 \U0001d601\U0001d5f5\U0001d5f2 \U0001d5d9\U0001d5e5\U0001d5d8\U0001d5d8 \U0001d603\U0001d5f2\U0001d5ff\U0001d600\U0001d5f6\U0001d5fc\U0001d5fb!
— Sarosij Ghosh (@sarosijghosh) September 18, 2021
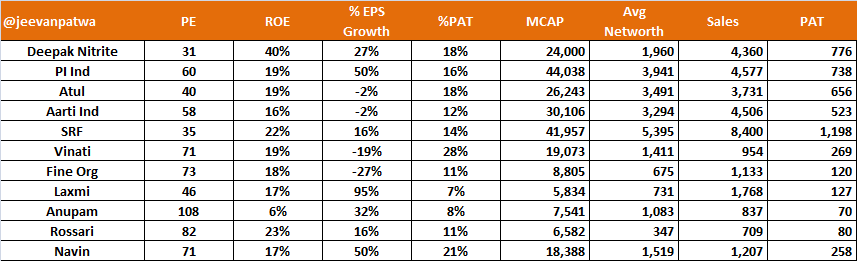
A THREAD \U0001f9f5
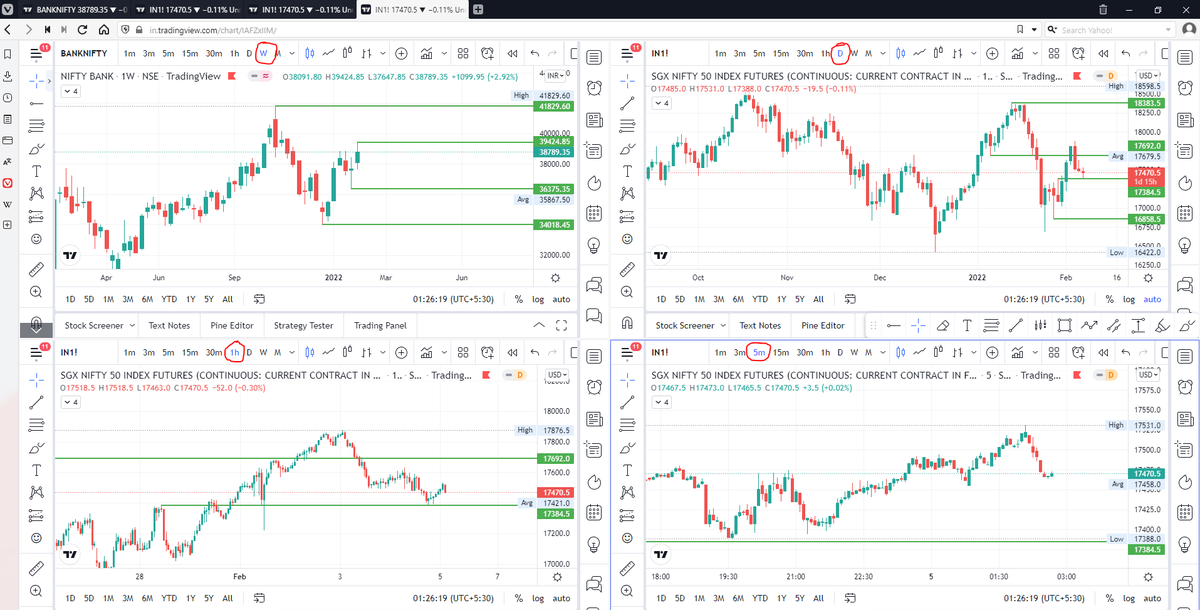
Please Like and Re-Tweet. It took a lot of effort to put this together. #StockMarket #TradingView #trading #watchlist #Nifty500 #stockstowatch

Ivor Cummins BE (Chem) is a former R&D Manager at HP (sourcre: https://t.co/Wbf5scf7gn), turned Content Creator/Podcast Host/YouTube personality. (Call it what you will.)
— Steve (@braidedmanga) November 17, 2020