3. The 200-day moving average line is trending up for at least 1-month (preferably 4 to 5 months or longer).
4. The 50-day (10-week moving average) is above both the 150-day and the 200-day moving averages.
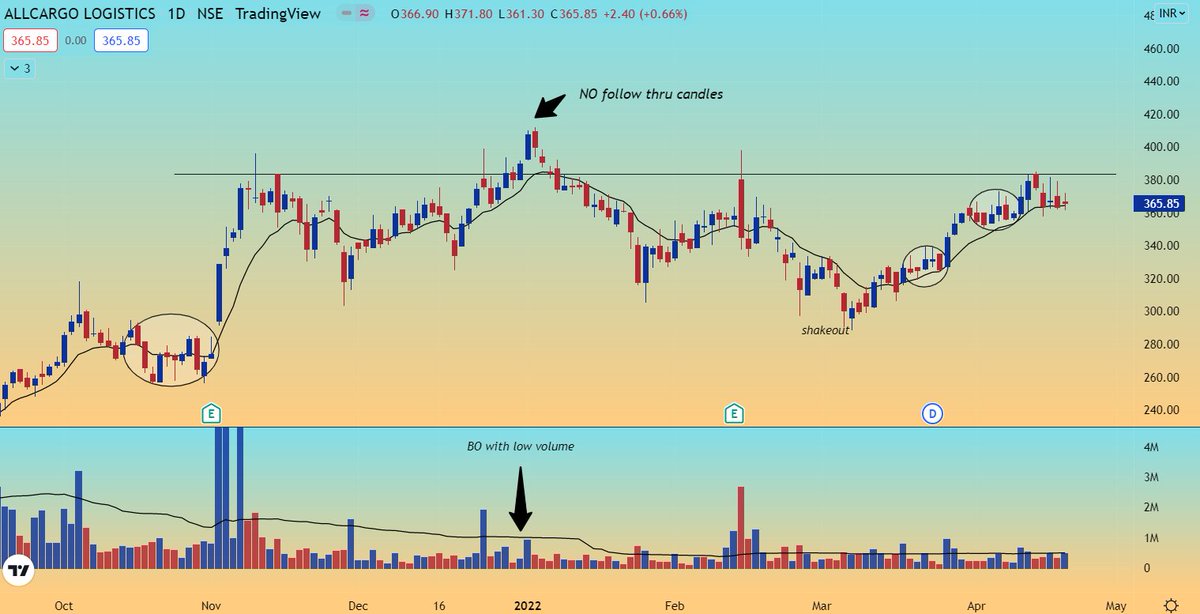
#AllCargo
— VCP Charts\U0001f4c8 (@vcpcharts) April 17, 2022
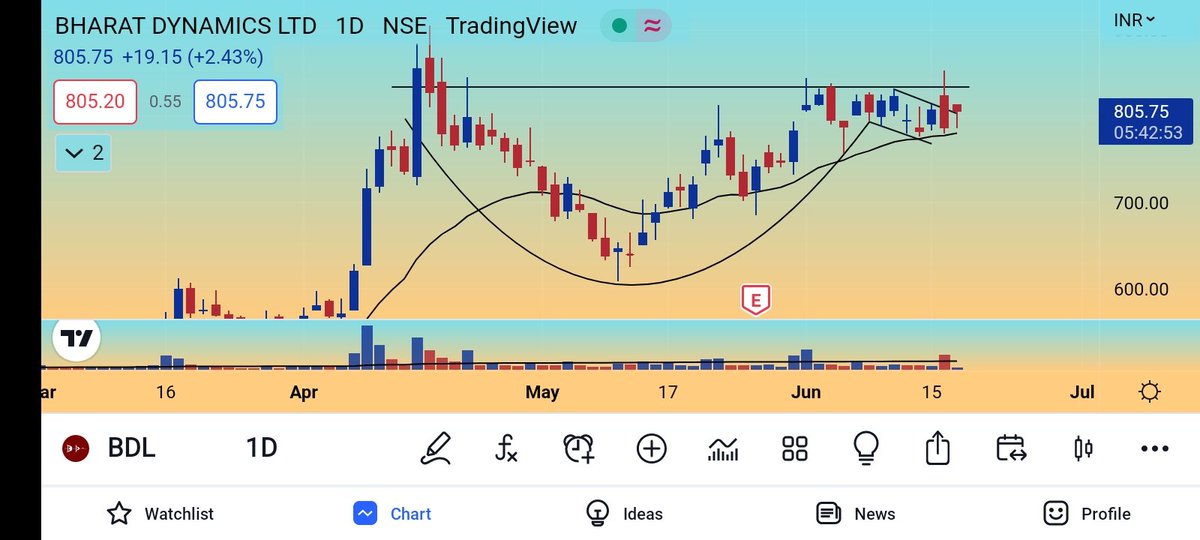
\U0001f3afGood accumulation from base bottom
\U0001f3af Pocket pivots and shakeout will give strength for breakout
\U0001f3af RS strength-81
\U0001f3af EPS strength-90
\U0001f3af Expecting more tightness near pivot point for entry@Accuracy_Invst @swing_ka_sultan @StocksNerd @VVVStockAnalyst @charts_zone pic.twitter.com/yb6pX4Kro5