I'm honestly at a loss as to understanding what our government is thinking & what evidence they're considering in enacting gravely negligent policies that will almost certainly lead to tens of thousands of deaths in the coming weeks. Thread.
What is decisive action?
When will government act on this? Both SAGE & @IndependentSage have urged urgent action.
Are we prepared to do nothing, and watch helplessly while thousands die of negligence?
More from Deepti Gurdasani
This is the exact problem with our government's thinking & response- despite this strategy of 'tolerating deaths' and half-way measures having spectacularly failed, it's quite amazing that our govt still hasn't learned anything, & continues to promote a policy of death. Thread
Had we adopted an elimination strategy early on, rather than one of tolerating a certain level of infection, we wouldn't be here now. The reason we're here is because the govt never committed to elimination.
We eased lockdown in May when infection levels were much higher than when other countries in Europe did this. The govt was warned about this, but did this to 'help the economy'. Not only did this lead us into the 2nd wave, the need for further lockdowns harmed the economy further
It's very clear from global evidence that we cannot 'tolerate a level of community transmission' and maintain 'R at or just below 1', which has been our governments policy for a long time. This isn't sustainable & very rapidly gets out of control, leading to exponential rises
Coupled with late action to contain these surges, not only does this lead to many more deaths, and much more morbidity with Long COVID, it also creates a fertile ground for viral mutations to accumulate with a greater risk of adaptation, which is exactly what happened in the UK
U.K. needs to confront
— Esther McVey (@EstherMcVey1) January 2, 2021
\u2018The challenge that faces us is to decide - are we going to try to pursue the elimination of Covid-19 regardless of the costs or decide on a tolerable level of deaths (like we do with the flu) in order to return to a normal life?\u2019
https://t.co/9hWbHIPJUq
Had we adopted an elimination strategy early on, rather than one of tolerating a certain level of infection, we wouldn't be here now. The reason we're here is because the govt never committed to elimination.
We eased lockdown in May when infection levels were much higher than when other countries in Europe did this. The govt was warned about this, but did this to 'help the economy'. Not only did this lead us into the 2nd wave, the need for further lockdowns harmed the economy further
It's very clear from global evidence that we cannot 'tolerate a level of community transmission' and maintain 'R at or just below 1', which has been our governments policy for a long time. This isn't sustainable & very rapidly gets out of control, leading to exponential rises
Coupled with late action to contain these surges, not only does this lead to many more deaths, and much more morbidity with Long COVID, it also creates a fertile ground for viral mutations to accumulate with a greater risk of adaptation, which is exactly what happened in the UK
Brief thread to debunk the repeated claims we hear about transmission not happening 'within school walls', infection in school children being 'a reflection of infection from the community', and 'primary school children less likely to get infected and contribute to transmission'.
I've heard a lot of scientists claim these three - including most recently the chief advisor to the CDC, where the claim that most transmission doesn't happen within the walls of schools. There is strong evidence to rebut this claim. Let's look at
Let's look at the trends of infection in different age groups in England first- as reported by the ONS. Being a random survey of infection in the community, this doesn't suffer from the biases of symptom-based testing, particularly important in children who are often asymptomatic
A few things to note:
1. The infection rates among primary & secondary school children closely follow school openings, closures & levels of attendance. E.g. We see a dip in infections following Oct half-term, followed by a rise after school reopening.
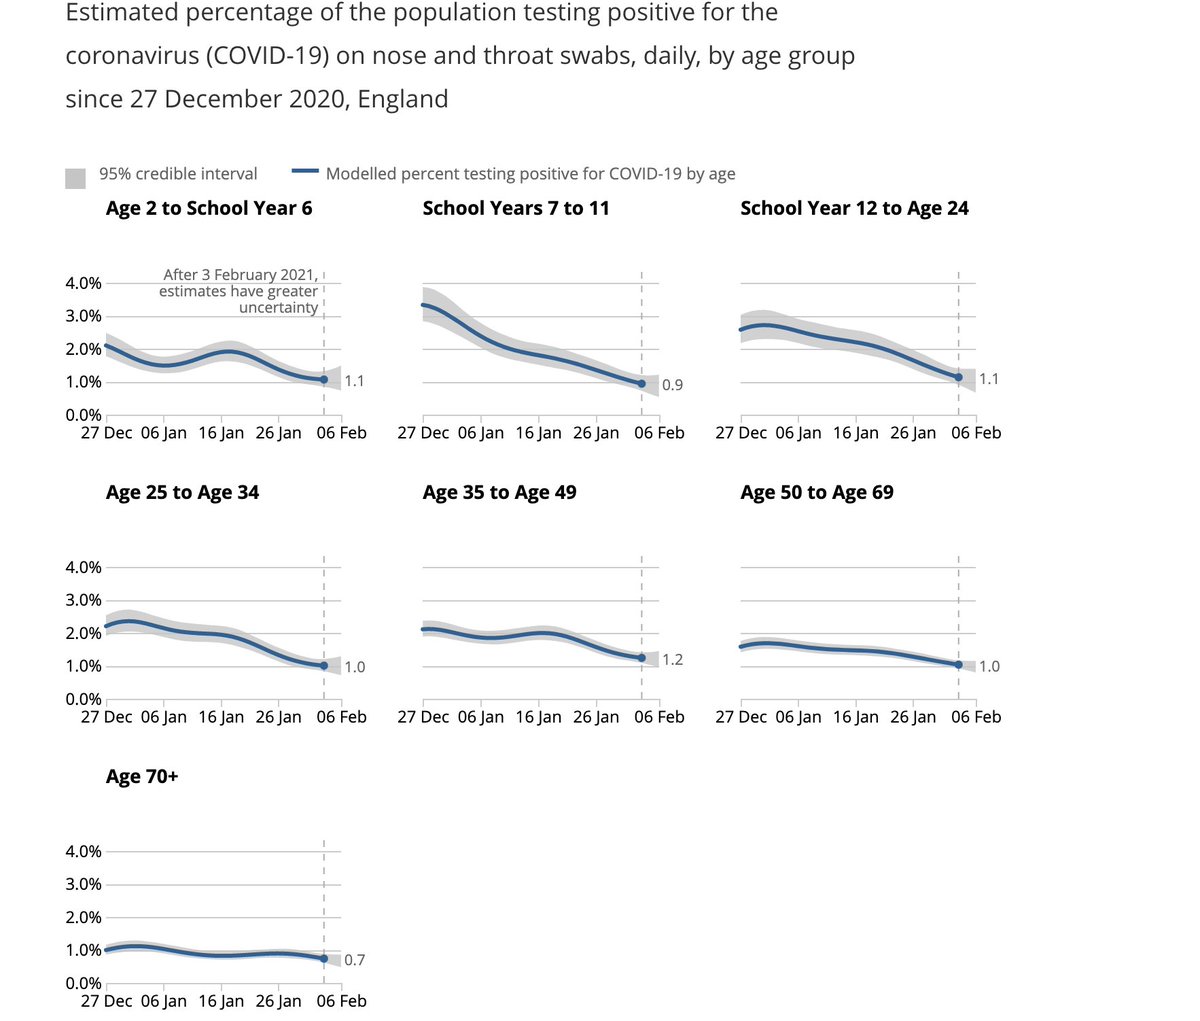
We see steep drops in both primary & secondary school groups after end of term (18th December), but these drops plateau out in primary school children, where attendance has been >20% after re-opening in January (by contrast with 2ndary schools where this is ~5%).
I've heard a lot of scientists claim these three - including most recently the chief advisor to the CDC, where the claim that most transmission doesn't happen within the walls of schools. There is strong evidence to rebut this claim. Let's look at
The science shows us that most disease transmission does not happen in the walls of the school, but it comes in from the community. So, CDC is advocating to get our K-5 students back in school at least in a hybrid mode with universal mask wearing and 6 ft of distancing. https://t.co/dfvJ2nl2s4
— Rochelle Walensky, MD, MPH (@CDCDirector) February 14, 2021
Let's look at the trends of infection in different age groups in England first- as reported by the ONS. Being a random survey of infection in the community, this doesn't suffer from the biases of symptom-based testing, particularly important in children who are often asymptomatic
A few things to note:
1. The infection rates among primary & secondary school children closely follow school openings, closures & levels of attendance. E.g. We see a dip in infections following Oct half-term, followed by a rise after school reopening.
We see steep drops in both primary & secondary school groups after end of term (18th December), but these drops plateau out in primary school children, where attendance has been >20% after re-opening in January (by contrast with 2ndary schools where this is ~5%).
We've been falsely told 'schools are safe', 'don't drive community transmission', & teachers don't have a higher risk of infection repeatedly by govt & their advisors- to justify some of the most negligent policies in history. 🧵
data shows *both* primary & secondary school teachers are at double the risk of confirmed infection relative to comparable positivity in the general population. ONS household infection data also clearly show that children are important sources of transmission.
Yet, in the parliamentary select meeting today, witnesses like Jenny Harries repeated the same claims- that have been debunked by the ONS data, and the data released by the @educationgovuk today. How many lives have been lost to these lies? How many more people have long COVID?
has repeatedly pointed out errors & gaps in the ONS reporting of evidence around risk of infection among teachers- and it's taken *months* to get clarity on this. The released data are a result of months of campaigning by her, the @NEU and others.
Rather than being transparent about the risk of transmission in school settings & mitigating this, the govt (& many of its advisors) has engaged in dismissing & denying evidence that's been clear for a while. Evidence from the govt's own surveys. And global evidence.
Why?
Questions have to be asked about the evidence Jenny Harries gave to the Education Committee today about the risk to teachers.
— Adam Hamdy (@adamhamdy) January 19, 2021
Was she aware of this data?
If not, why wasn\u2019t she properly briefed?#COVID19 #schools https://t.co/4wa1PyAJld pic.twitter.com/eqFjaA1zYC
data shows *both* primary & secondary school teachers are at double the risk of confirmed infection relative to comparable positivity in the general population. ONS household infection data also clearly show that children are important sources of transmission.
Yet, in the parliamentary select meeting today, witnesses like Jenny Harries repeated the same claims- that have been debunked by the ONS data, and the data released by the @educationgovuk today. How many lives have been lost to these lies? How many more people have long COVID?
has repeatedly pointed out errors & gaps in the ONS reporting of evidence around risk of infection among teachers- and it's taken *months* to get clarity on this. The released data are a result of months of campaigning by her, the @NEU and others.
Rather than being transparent about the risk of transmission in school settings & mitigating this, the govt (& many of its advisors) has engaged in dismissing & denying evidence that's been clear for a while. Evidence from the govt's own surveys. And global evidence.
Why?
More from Government


Canada is failing to act on Climate Change. @wef @WorldBank @IMFNews @IPCC_CH @UNDPGAIN @AntiCorruptIntl @Pontifex @JustinWelby @OCCRP @StopCorpAbuse @TaxJusticeNet @FairTaxCanada @ecojustice_ca @WCELaw @CanEnvLawAssn @envirodefence @IBA_Canada #cdnpoli
Covid recovery money is going to the oligarchy.
Ottawa and the provinces have put very little on the table to help clean-tech companies directly during Covid 19 while targeting fossil-fuel producers with more than $16 billion in aid.
Coast to coast people have demanded treaties be honored. We demanded climate action, divestment and land back but Canada is not listening. This video shows 10 years of rallies in Waterloo Ontario. City & regional council declared a climate emergency. 🚨
The Bank of China (BOC), SNC-Lavalin and WE Charity were recipients of taxpayer-funded the Covid 19 Canadian Emergency Wage Subsidy (CEWS)
Canada: Falling Far Short On Climate Policy, Emissions Reduction and Energy Transition #cdnpoli #bcpoli #alpolitics #onpoli @JimHarris @MikeHudema @SethDKlein @ElizabethMay @CitizensLobbyCa @lulex @kainagata https://t.co/jhm1TXvAKN pic.twitter.com/yEPINC5PTr
— Below2\xb0C (@Below2C_) December 29, 2020
Covid recovery money is going to the oligarchy.
Ottawa and the provinces have put very little on the table to help clean-tech companies directly during Covid 19 while targeting fossil-fuel producers with more than $16 billion in aid.
Coast to coast people have demanded treaties be honored. We demanded climate action, divestment and land back but Canada is not listening. This video shows 10 years of rallies in Waterloo Ontario. City & regional council declared a climate emergency. 🚨
The Bank of China (BOC), SNC-Lavalin and WE Charity were recipients of taxpayer-funded the Covid 19 Canadian Emergency Wage Subsidy (CEWS)


You May Also Like


"I really want to break into Product Management"
make products.
"If only someone would tell me how I can get a startup to notice me."
Make Products.
"I guess it's impossible and I'll never break into the industry."
MAKE PRODUCTS.
Courtesy of @edbrisson's wonderful thread on breaking into comics – https://t.co/TgNblNSCBj – here is why the same applies to Product Management, too.
There is no better way of learning the craft of product, or proving your potential to employers, than just doing it.
You do not need anybody's permission. We don't have diplomas, nor doctorates. We can barely agree on a single standard of what a Product Manager is supposed to do.
But – there is at least one blindingly obvious industry consensus – a Product Manager makes Products.
And they don't need to be kept at the exact right temperature, given endless resource, or carefully protected in order to do this.
They find their own way.
make products.
"If only someone would tell me how I can get a startup to notice me."
Make Products.
"I guess it's impossible and I'll never break into the industry."
MAKE PRODUCTS.
Courtesy of @edbrisson's wonderful thread on breaking into comics – https://t.co/TgNblNSCBj – here is why the same applies to Product Management, too.
"I really want to break into comics"
— Ed Brisson (@edbrisson) December 4, 2018
make comics.
"If only someone would tell me how I can get an editor to notice me."
Make Comics.
"I guess it's impossible and I'll never break into the industry."
MAKE COMICS.
There is no better way of learning the craft of product, or proving your potential to employers, than just doing it.
You do not need anybody's permission. We don't have diplomas, nor doctorates. We can barely agree on a single standard of what a Product Manager is supposed to do.
But – there is at least one blindingly obvious industry consensus – a Product Manager makes Products.
And they don't need to be kept at the exact right temperature, given endless resource, or carefully protected in order to do this.
They find their own way.