
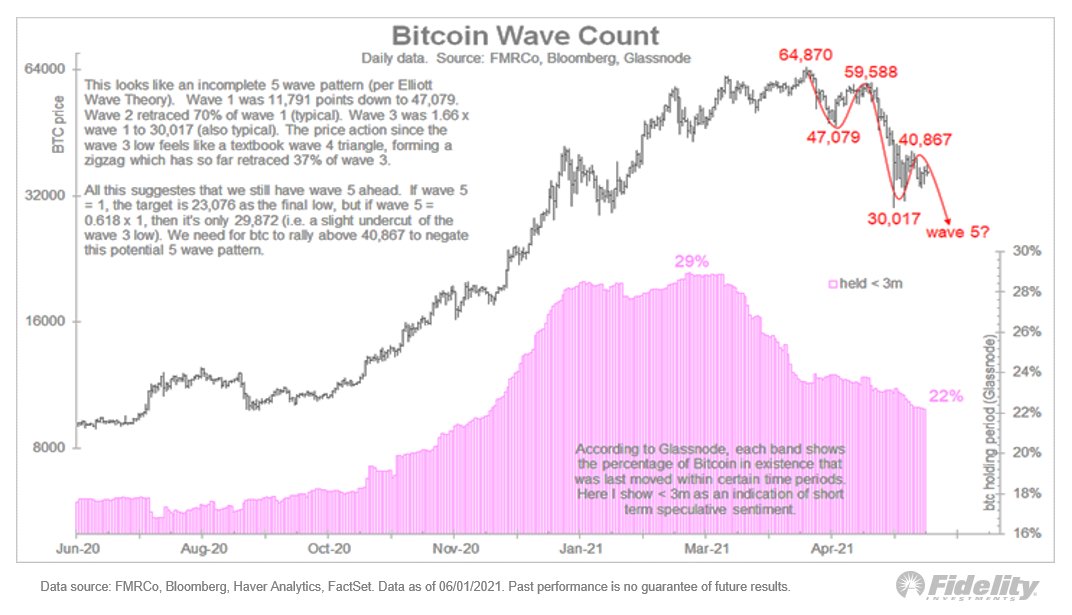
As a “lifelong” technician, I am finding that bitcoin lends itself well to technical analysis. Here is my take on the recent price action. (THREAD)

More from Crypto


A primer on how to use @coingecko for your crypto data/research/trading needs.
Share it with a friend who needs it!
1/ Getting started with crypto and want to check prices/projects? https://t.co/LFnk4vukxj has info on just about every crypto you'll need :)
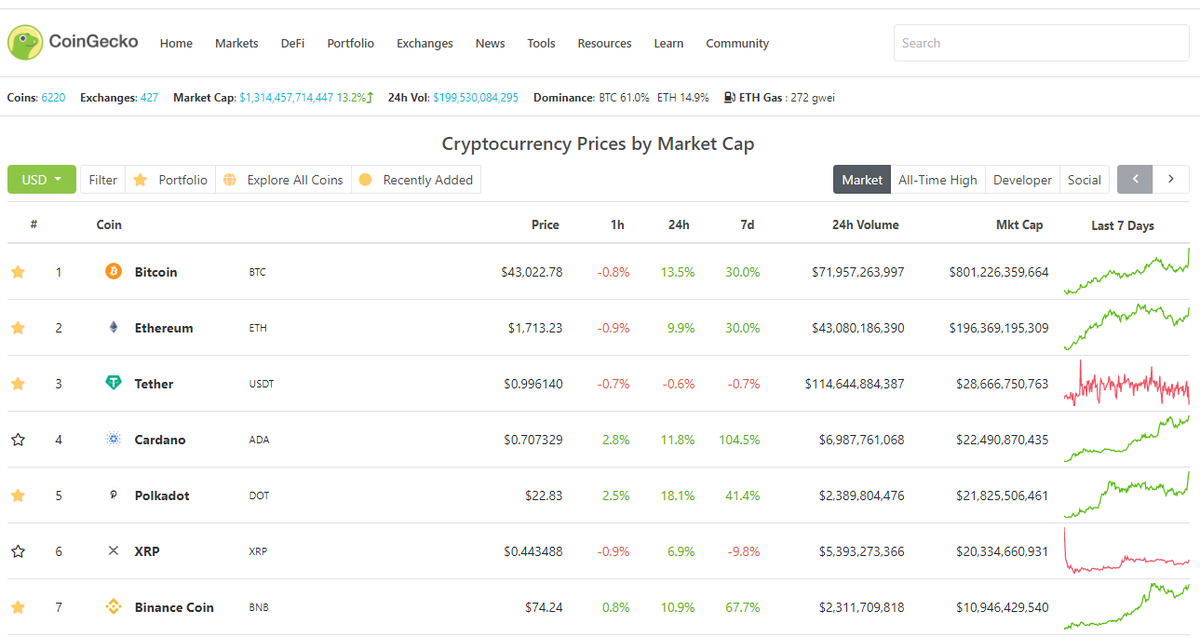
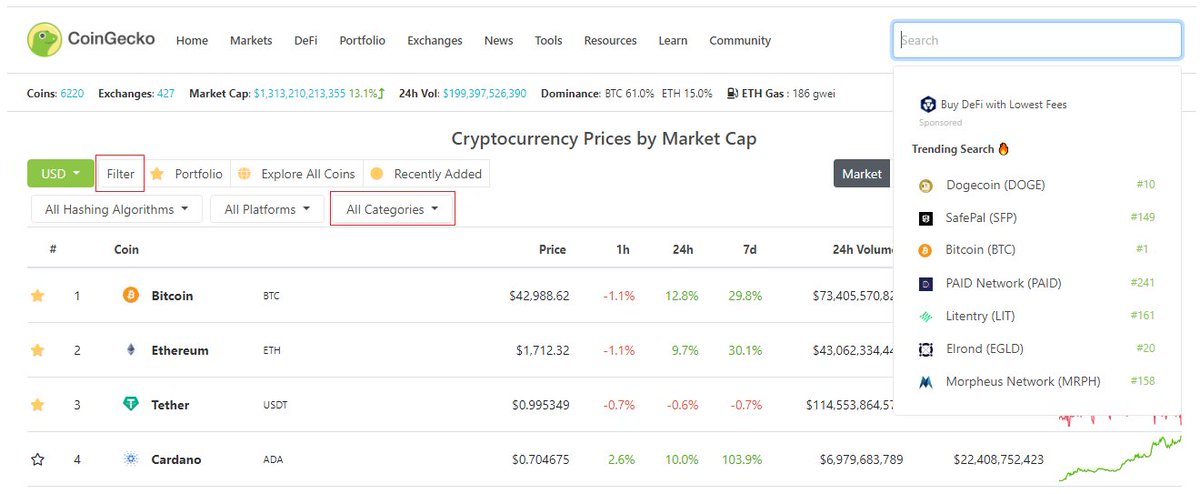
2/ Search over 6000+ cryptocurrencies available on the market. You can see what's trending in the space as well.
Researching by categories? Filter (left side) -> Select categories -> DeFi, DOT ecosystem, Exchange-based tokens, NFTs - anything!
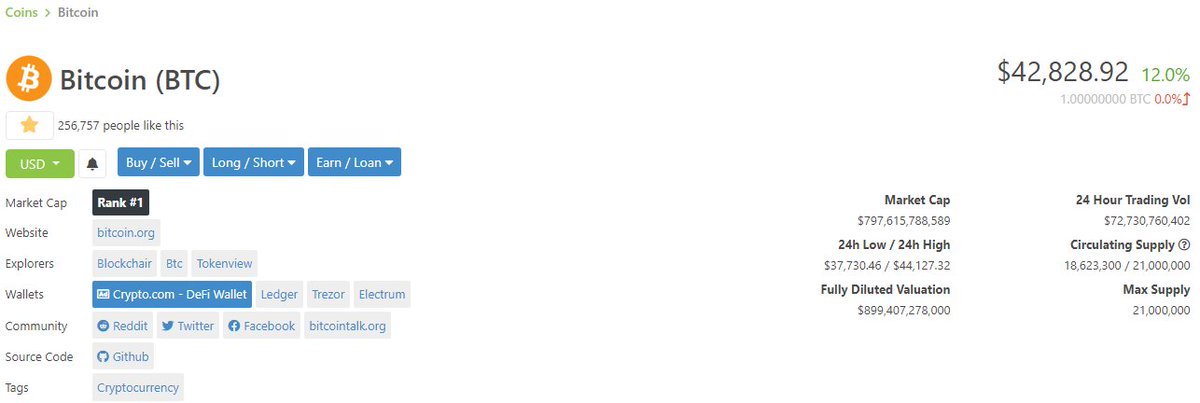
3/ Lets say you're looking at #Bitcoin https://t.co/g205lj03pG
At a glance you get:
- Price
- Mkt Capitalization (valuation)
- Circulating/Total supply
- 24h trading volume
- Links to websites, social media, block explorers
- Calculator
Next - check valuation?
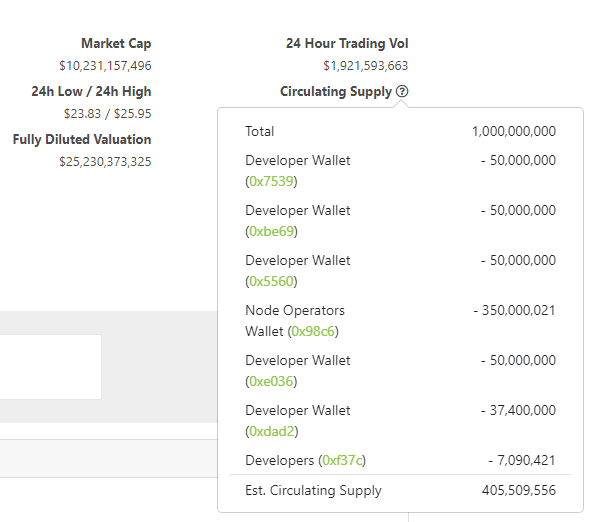
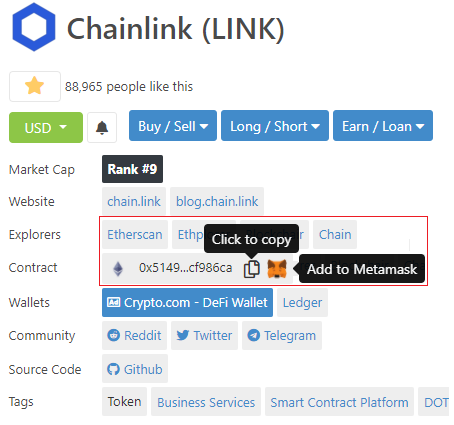
4/ Market cap is used to rank coins, and we'll show you how its calculated - Hover over Circulating Supply (?) for breakdown.
Note: used @chainlink as example here - https://t.co/Jc46fe79Ag
While MC is important also consider product fit, narrative, team, community etc.
5/ If you're trading on AMMs like @Uniswap or @SushiSwap, you can copy the contract address directly to your clipboard.
Using @metamask_io? Add the token directly so it shows as one of the "Assets" that you own in the wallet.
See: https://t.co/94XihMf5oz
Share it with a friend who needs it!
1/ Getting started with crypto and want to check prices/projects? https://t.co/LFnk4vukxj has info on just about every crypto you'll need :)
2/ Search over 6000+ cryptocurrencies available on the market. You can see what's trending in the space as well.
Researching by categories? Filter (left side) -> Select categories -> DeFi, DOT ecosystem, Exchange-based tokens, NFTs - anything!
3/ Lets say you're looking at #Bitcoin https://t.co/g205lj03pG
At a glance you get:
- Price
- Mkt Capitalization (valuation)
- Circulating/Total supply
- 24h trading volume
- Links to websites, social media, block explorers
- Calculator
Next - check valuation?
4/ Market cap is used to rank coins, and we'll show you how its calculated - Hover over Circulating Supply (?) for breakdown.
Note: used @chainlink as example here - https://t.co/Jc46fe79Ag
While MC is important also consider product fit, narrative, team, community etc.
5/ If you're trading on AMMs like @Uniswap or @SushiSwap, you can copy the contract address directly to your clipboard.
Using @metamask_io? Add the token directly so it shows as one of the "Assets" that you own in the wallet.
See: https://t.co/94XihMf5oz
Introducing an effortless way to add tokens to your @metamask_io wallet \U0001f4e5
— CoinGecko (@coingecko) February 8, 2021
Skip the hassle of copying/pasting contract addresses to your wallet. Add an asset and it'll appear in your wallet with just a click - tap the \U0001f98a and try it out for yourself! pic.twitter.com/u26BA29ubs


You May Also Like


And here they are...
THE WINNERS OF THE 24 HOUR STARTUP CHALLENGE
Remember, this money is just fun. If you launched a product (or even attempted a launch) - you did something worth MUCH more than $1,000.
#24hrstartup
The winners 👇
#10
Lattes For Change - Skip a latte and save a life.
https://t.co/M75RAirZzs
@frantzfries built a platform where you can see how skipping your morning latte could do for the world.
A great product for a great cause.
Congrats Chris on winning $250!

#9
Instaland - Create amazing landing pages for your followers.
https://t.co/5KkveJTAsy
A team project! @bpmct and @BaileyPumfleet built a tool for social media influencers to create simple "swipe up" landing pages for followers.
Really impressive for 24 hours. Congrats!

#8
SayHenlo - Chat without distractions
https://t.co/og0B7gmkW6
Built by @DaltonEdwards, it's a platform for combatting conversation overload. This product was also coded exclusively from an iPad 😲
Dalton is a beast. I'm so excited he placed in the top 10.

#7
CoderStory - Learn to code from developers across the globe!
https://t.co/86Ay6nF4AY
Built by @jesswallaceuk, the project is focused on highlighting the experience of developers and people learning to code.
I wish this existed when I learned to code! Congrats on $250!!

THE WINNERS OF THE 24 HOUR STARTUP CHALLENGE
Remember, this money is just fun. If you launched a product (or even attempted a launch) - you did something worth MUCH more than $1,000.
#24hrstartup
The winners 👇
#10
Lattes For Change - Skip a latte and save a life.
https://t.co/M75RAirZzs
@frantzfries built a platform where you can see how skipping your morning latte could do for the world.
A great product for a great cause.
Congrats Chris on winning $250!
#9
Instaland - Create amazing landing pages for your followers.
https://t.co/5KkveJTAsy
A team project! @bpmct and @BaileyPumfleet built a tool for social media influencers to create simple "swipe up" landing pages for followers.
Really impressive for 24 hours. Congrats!
#8
SayHenlo - Chat without distractions
https://t.co/og0B7gmkW6
Built by @DaltonEdwards, it's a platform for combatting conversation overload. This product was also coded exclusively from an iPad 😲
Dalton is a beast. I'm so excited he placed in the top 10.
#7
CoderStory - Learn to code from developers across the globe!
https://t.co/86Ay6nF4AY
Built by @jesswallaceuk, the project is focused on highlighting the experience of developers and people learning to code.
I wish this existed when I learned to code! Congrats on $250!!


@EricTopol @NBA @StephenKissler @yhgrad B.1.1.7 reveals clearly that SARS-CoV-2 is reverting to its original pre-outbreak condition, i.e. adapted to transgenic hACE2 mice (either Baric's BALB/c ones or others used at WIV labs during chimeric bat coronavirus experiments aimed at developing a pan betacoronavirus vaccine)
@NBA @StephenKissler @yhgrad 1. From Day 1, SARS-COV-2 was very well adapted to humans .....and transgenic hACE2 Mice
@NBA @StephenKissler @yhgrad 2. High Probability of serial passaging in Transgenic Mice expressing hACE2 in genesis of SARS-COV-2
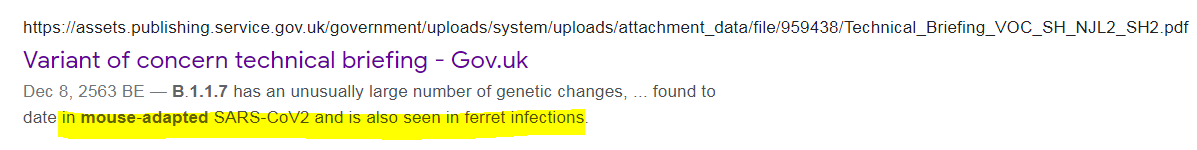
@NBA @StephenKissler @yhgrad B.1.1.7 has an unusually large number of genetic changes, ... found to date in mouse-adapted SARS-CoV2 and is also seen in ferret infections.
https://t.co/9Z4oJmkcKj
@NBA @StephenKissler @yhgrad We adapted a clinical isolate of SARS-CoV-2 by serial passaging in the ... Thus, this mouse-adapted strain and associated challenge model should be ... (B) SARS-CoV-2 genomic RNA loads in mouse lung homogenates at P0 to P6.
https://t.co/I90OOCJg7o
@NBA @StephenKissler @yhgrad 1. From Day 1, SARS-COV-2 was very well adapted to humans .....and transgenic hACE2 Mice
1. From Day 1, SARS-COV-2 was very well adapted to humans .....and transgenic hACE2 Mice
— Billy Bostickson \U0001f3f4\U0001f441&\U0001f441 \U0001f193 (@BillyBostickson) January 30, 2021
"we generated a mouse model expressing hACE2 by using CRISPR/Cas9 knockin technology. In comparison with wild-type C57BL/6 mice, both young & aged hACE2 mice sustained high viral loads... pic.twitter.com/j94XtSkscj
@NBA @StephenKissler @yhgrad 2. High Probability of serial passaging in Transgenic Mice expressing hACE2 in genesis of SARS-COV-2
1. High Probability of serial passaging in Transgenic Mice expressing hACE2 in genesis of SARS-COV-2!
— Billy Bostickson \U0001f3f4\U0001f441&\U0001f441 \U0001f193 (@BillyBostickson) January 2, 2021
2 papers:
Human\u2013viral molecular mimicryhttps://t.co/irfH0Zgrve
Molecular Mimicryhttps://t.co/yLQoUtfS6s https://t.co/lsCv2iMEQz
@NBA @StephenKissler @yhgrad B.1.1.7 has an unusually large number of genetic changes, ... found to date in mouse-adapted SARS-CoV2 and is also seen in ferret infections.
https://t.co/9Z4oJmkcKj
@NBA @StephenKissler @yhgrad We adapted a clinical isolate of SARS-CoV-2 by serial passaging in the ... Thus, this mouse-adapted strain and associated challenge model should be ... (B) SARS-CoV-2 genomic RNA loads in mouse lung homogenates at P0 to P6.
https://t.co/I90OOCJg7o