Authors Youyang Gu
7 days
30 days
All time
Recent
Popular

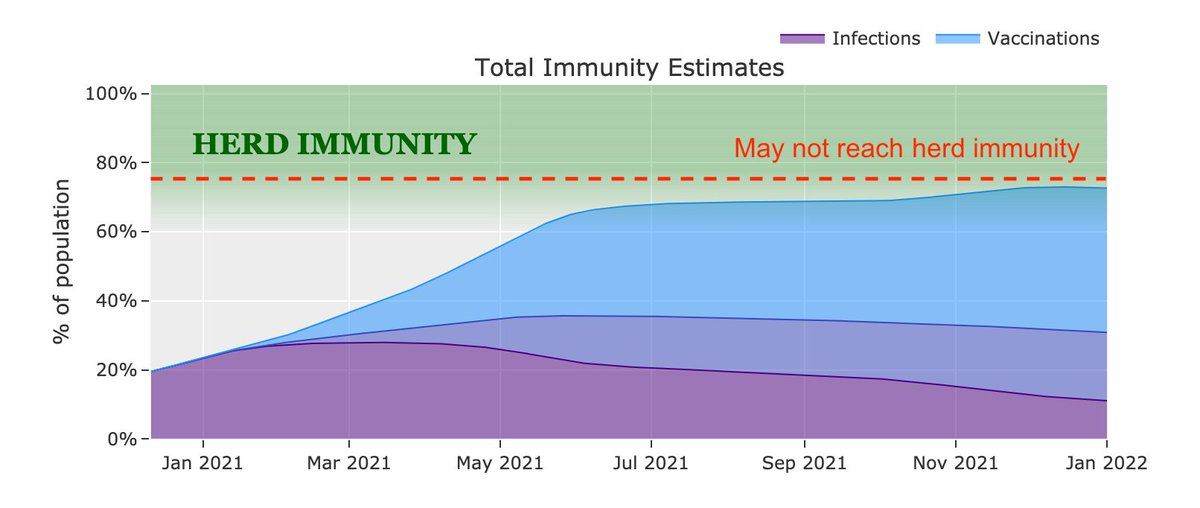
I've seen many news articles cite that "the UK variant could be the dominant strain by March". This is emphasized by @CDCDirector.
While this will likely to be the case, this should not be an automatic cause for concern. Cases could still remain contained.
Here's how: 🧵
One of @CDCgov's own models has tracked the true decline in cases quite accurately thus far.
Their projection shows that the B.1.1.7 variant will become the dominant variant in March. But interestingly... there's no fourth wave. Cases simply level out:
https://t.co/tDce0MwO61
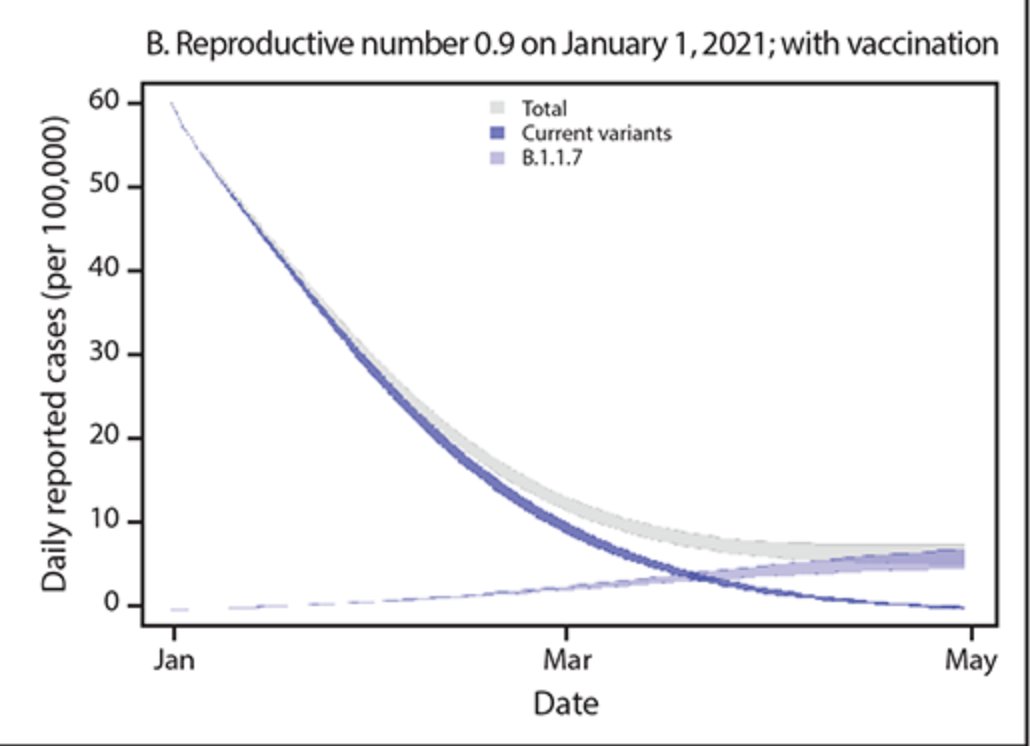
Just because a variant becomes the dominant strain does not automatically mean we will see a repeat of Fall 2020.
Let's look at UK and South Africa, where cases have been falling for the past month, in unison with the US (albeit with tougher restrictions):
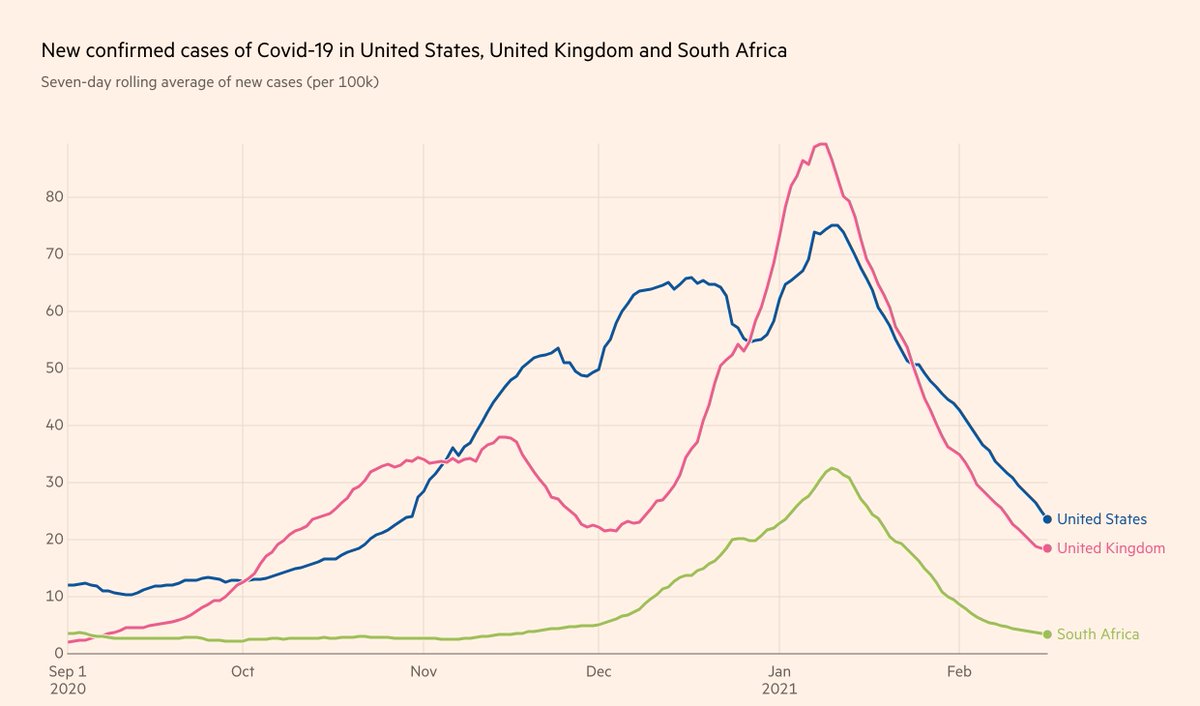
Furthermore, the claim that the "variant is doubling every 10 days" is false. It's the *proportion of the variant* that is doubling every 10 days.
If overall prevalence drops during the studied time period, the true doubling time of the variant is actually much longer 10 days.
Simple example:
Day 0: 10 variant / 100 cases -> 10% variant
Day 10: 15 variant / 75 cases -> 20% variant
Day 20: 20 variant / 50 cases -> 40% variant
1) Proportion of variant doubles every 10 days
2) Doubling time of variant is actually 20 days
3) Total cases still drop by 50%
While this will likely to be the case, this should not be an automatic cause for concern. Cases could still remain contained.
Here's how: 🧵
One of @CDCgov's own models has tracked the true decline in cases quite accurately thus far.
Their projection shows that the B.1.1.7 variant will become the dominant variant in March. But interestingly... there's no fourth wave. Cases simply level out:
https://t.co/tDce0MwO61
Just because a variant becomes the dominant strain does not automatically mean we will see a repeat of Fall 2020.
Let's look at UK and South Africa, where cases have been falling for the past month, in unison with the US (albeit with tougher restrictions):
Furthermore, the claim that the "variant is doubling every 10 days" is false. It's the *proportion of the variant* that is doubling every 10 days.
If overall prevalence drops during the studied time period, the true doubling time of the variant is actually much longer 10 days.
Simple example:
Day 0: 10 variant / 100 cases -> 10% variant
Day 10: 15 variant / 75 cases -> 20% variant
Day 20: 20 variant / 50 cases -> 40% variant
1) Proportion of variant doubles every 10 days
2) Doubling time of variant is actually 20 days
3) Total cases still drop by 50%
Which metric is a better predictor of the severity of the fall surge in US states?
1) Margin of Democrat victory in Nov 2020 election
or
2) % infected through Sep 1, 2020
Can you guess which plot is which?

The left plot is based on the % infected through Sep 1, 2020. You can see that there is very little correlation with the % infected since Sep 1.
However, there is a *strong* correlation when using the margin of Biden's victory (right).
Infections % from https://t.co/WcXlfxv3Ah.

This is the strongest single variable I've seen in being able to explain the severity of this most recent wave in each state.
Not past infections / existing immunity, population density, racial makeup, latitude / weather / humidity, etc.
But political lean.
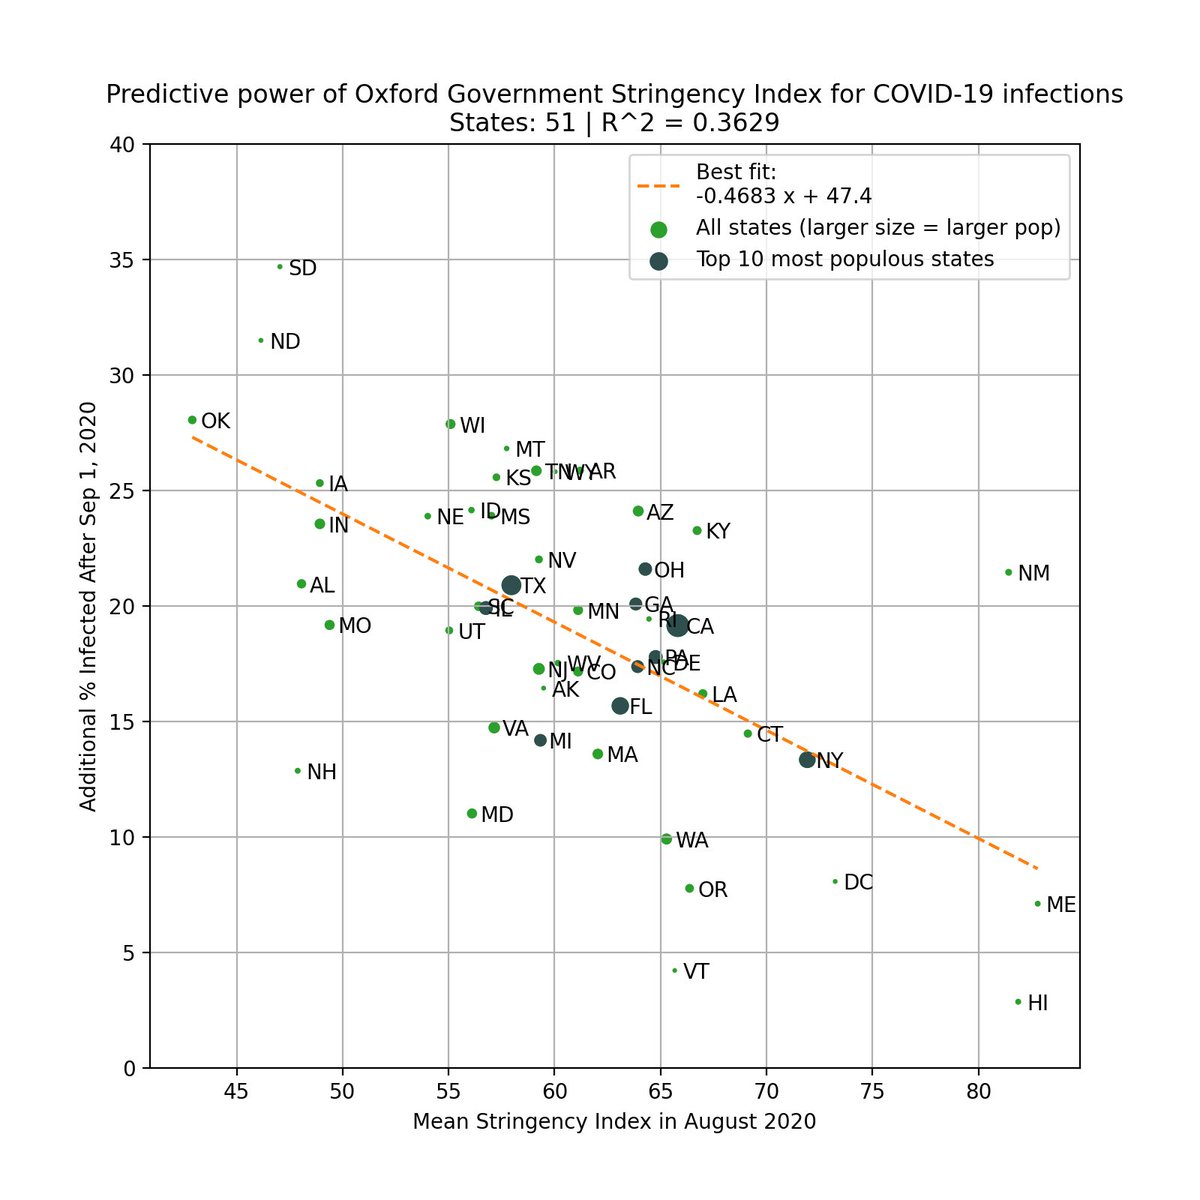
One can argue that states that lean Democrat are more likely to implement restrictions/mandates.
This is valid, so we test this by using the Government Stringency Index made by @UniofOxford.
We also see a correlation, but it's weaker (R^2=0.36 vs 0.50).
https://t.co/BxBBKwW6ta
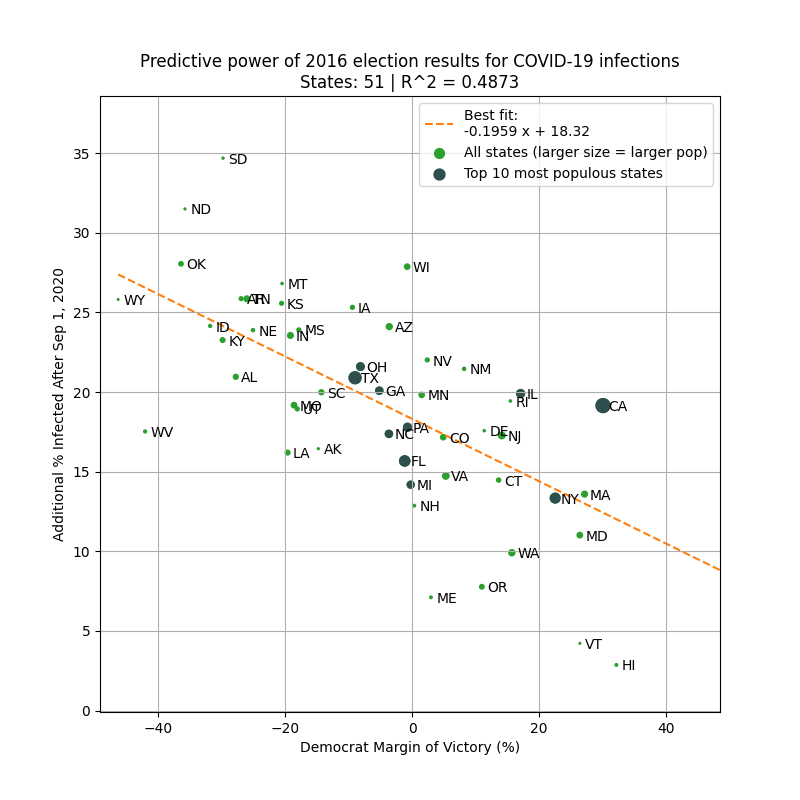
To avoid look-ahead bias/confounding variables, here is the same analysis but using 2016 margin of victory as the predictor. Similar results.
This basically says that 2016 election results is a better predictor of the severity of the fall wave than intervention levels in 2020!
1) Margin of Democrat victory in Nov 2020 election
or
2) % infected through Sep 1, 2020
Can you guess which plot is which?
The left plot is based on the % infected through Sep 1, 2020. You can see that there is very little correlation with the % infected since Sep 1.
However, there is a *strong* correlation when using the margin of Biden's victory (right).
Infections % from https://t.co/WcXlfxv3Ah.
This is the strongest single variable I've seen in being able to explain the severity of this most recent wave in each state.
Not past infections / existing immunity, population density, racial makeup, latitude / weather / humidity, etc.
But political lean.
One can argue that states that lean Democrat are more likely to implement restrictions/mandates.
This is valid, so we test this by using the Government Stringency Index made by @UniofOxford.
We also see a correlation, but it's weaker (R^2=0.36 vs 0.50).
https://t.co/BxBBKwW6ta
To avoid look-ahead bias/confounding variables, here is the same analysis but using 2016 margin of victory as the predictor. Similar results.
This basically says that 2016 election results is a better predictor of the severity of the fall wave than intervention levels in 2020!