Authors Blake Burge 💡
8 steps to build the life you want. 🧵
Clock In:
It's time to go to work.
There are no magic bullets & "get-rich-quick" doesn't exist in the real world.
Immerse yourself in learning, have a bias toward action, be willing to do what others won't.
Do this & you won't need to look for results, they'll find you.
Work from the top down:
The fastest way to get from where you are to where you want to be?
Find someone who's already there.
Learn from them, seek advice, & follow the path they've forged.
Reach out.
People are more willing to help than you think.
One of the only true shortcuts in life is finding an expert and apprenticing under them.
— James Clear (@JamesClear) July 23, 2021
Persist:
The bigger your goals, the more likely it is they'll take longer to achieve.
Most people fail when they quit right before their plan is beginning to work.
By stopping, they never know how close they actually were.
Be consistent. Keep going.
h/t@visualizevalue

Build your personal brand:
We're all selling something, often it's ourselves.
Give before you get.
Provide value, be unique, be consistent.
Once people know what to expect from you, they'll come back for more.
The best advertisement in the world is repeatable results.
11 Tweets to change your life. 🧵
1/ Learn Anything:
A masterclass from my friend @SahilBloom
The 6-step framework he uses to learn anything.
(1) Identify & Establish
(2) Research
(3) Skin in the Game
(4) Engage Community
(5) Teach
(6) Reflect &
Learning is a skill.
— Sahil Bloom (@SahilBloom) August 28, 2021
Here's a tactical approach to learning anything:
2/ A cheat sheet for building your career:
20 things you'll wish you knew sooner.
An amazing piece by @RomeenSheth on career
Early career years are painful.
— Romeen Sheth (@RomeenSheth) July 27, 2021
You feel like an idiot 98% of the time - lost, confused and insecure.
I wish I had a cheat sheet of principles for my first job.
So I put one together.
Here are 20 things about building a career I wish I knew sooner:
3/ The 5 Traits of Elite Individuals:
I'm not sure what rock I've been living under...
I've somehow just now stumbled across @NdamukongSuh's Twitter content.
It's a goldmine.
Case in point
It's been over a decade since I kicked off my career.
— Ndamukong Suh (@NdamukongSuh) August 27, 2021
I've worked with, invested in, and mentored some of the most elite people on the planet.
And you know what I've noticed? \U0001f440
From Tom Brady to Warren Buffet, they all have five things in common.
If you're curious \U0001f9f5
4/ Where you are -> Where you're going:
•Be consistent
•Set higher standards
•Learn to say "no" more
We ALL have a problem.
— Blake Burge \U0001f4a1 (@blakeaburge) July 10, 2021
We overestimate what can be done in a day, yet underestimate what can be accomplished in a week, month, or year.
THREAD: 10 Steps to get from where you are to where you want to be. pic.twitter.com/uRJuCfldII
But it's more powerful than you think.
8 things Google Sheets can do, you'll wish you knew yesterday. 📊
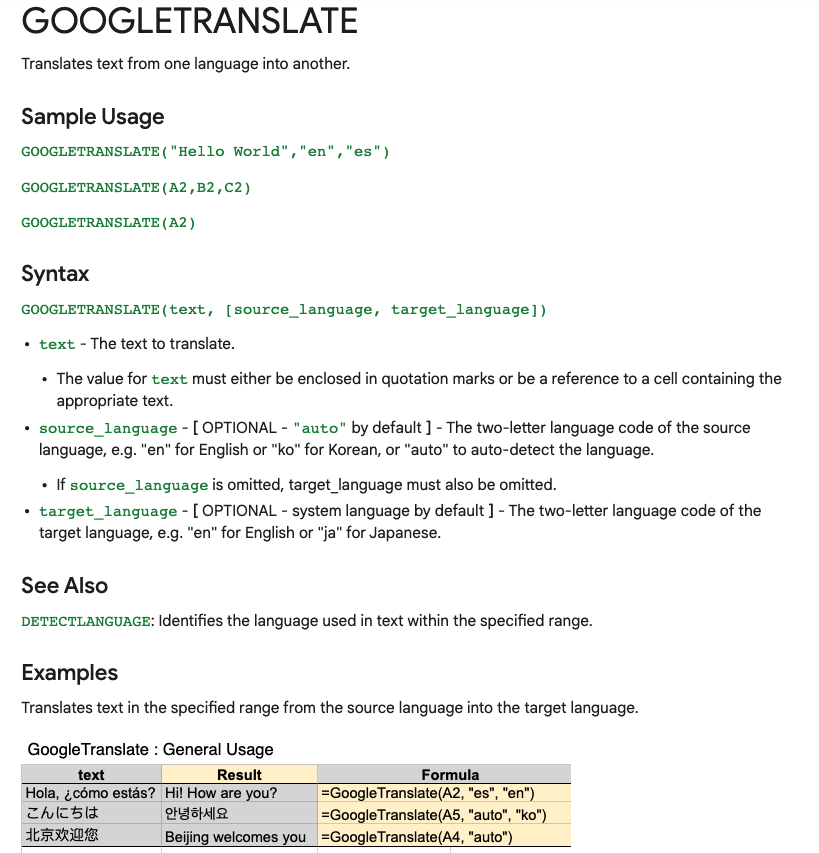
Translate Text:
Need to convert data from one language to another?
Enter:
=GOOGLETRANSLATE("A2","en","es")
This will translate the words in cell "A2" from English to Spanish.
Replace "en" with "auto" and Sheets will identify the source language automatically.
Timesavers:
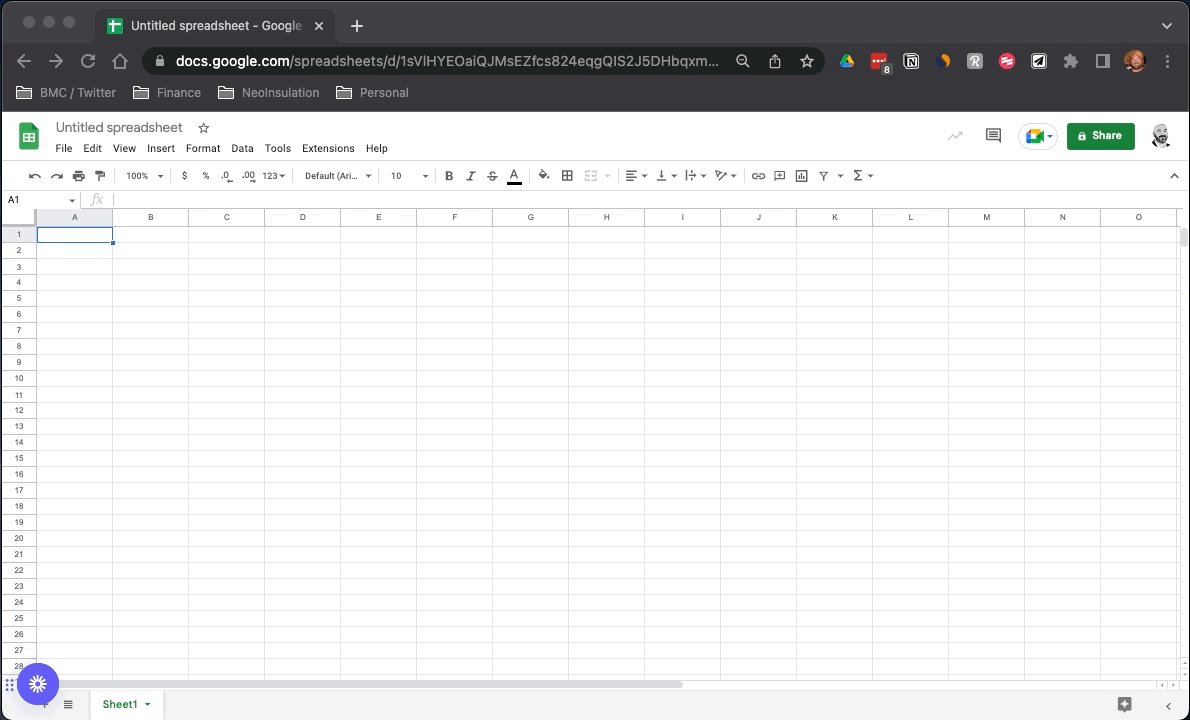
Assuming you're signed in to your Google account, head on up to your browser's address bar:
From there type: "https://t.co/BeKgYV7g31"
Boom! A new Google sheet is created for you on the fly from anywhere on the web.
(Works for docs too)
Pretty cool!
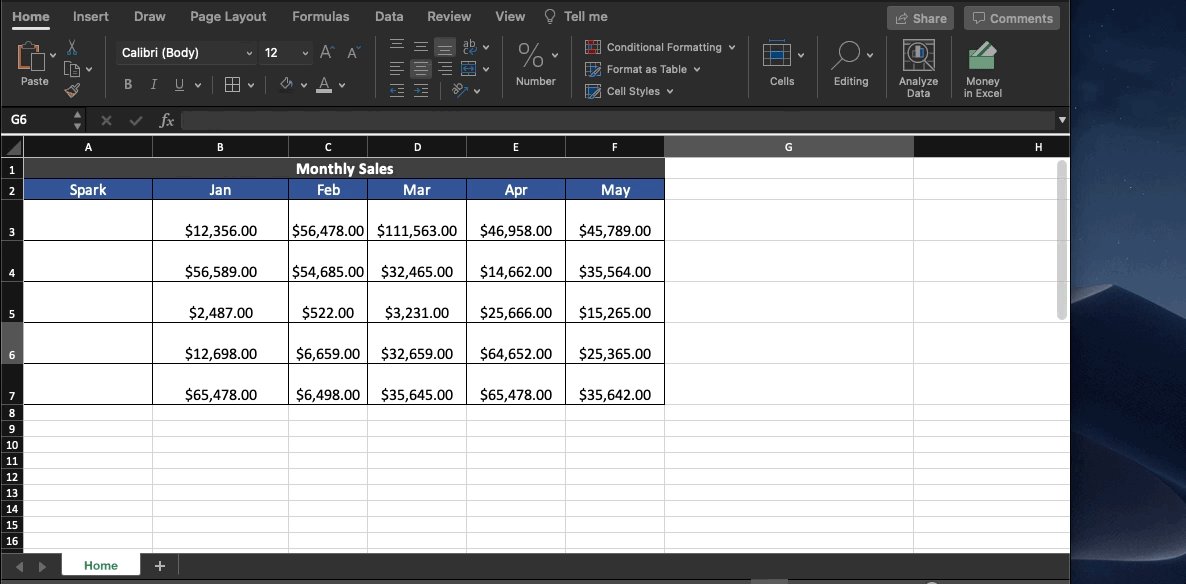
Sparklines:
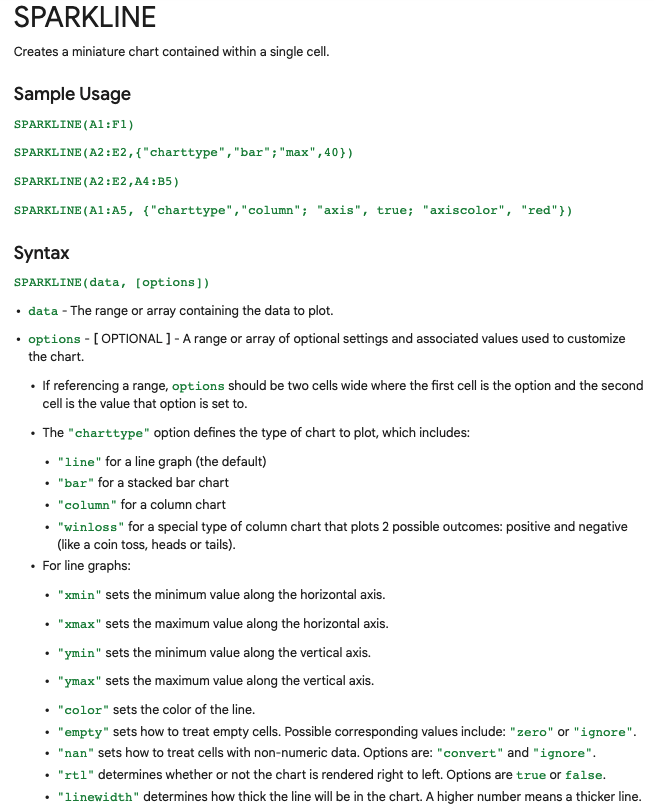
Easily visualize data trends by adding sparklines to your sheet.
To add a basic "mini-graph" inside a cell, it's as simple as inputting:
=SPARKLINE (A1:F1) – (Where A1:F1 represents your range of data.)
For more detailed options, check this out:👇🏻
Explore:
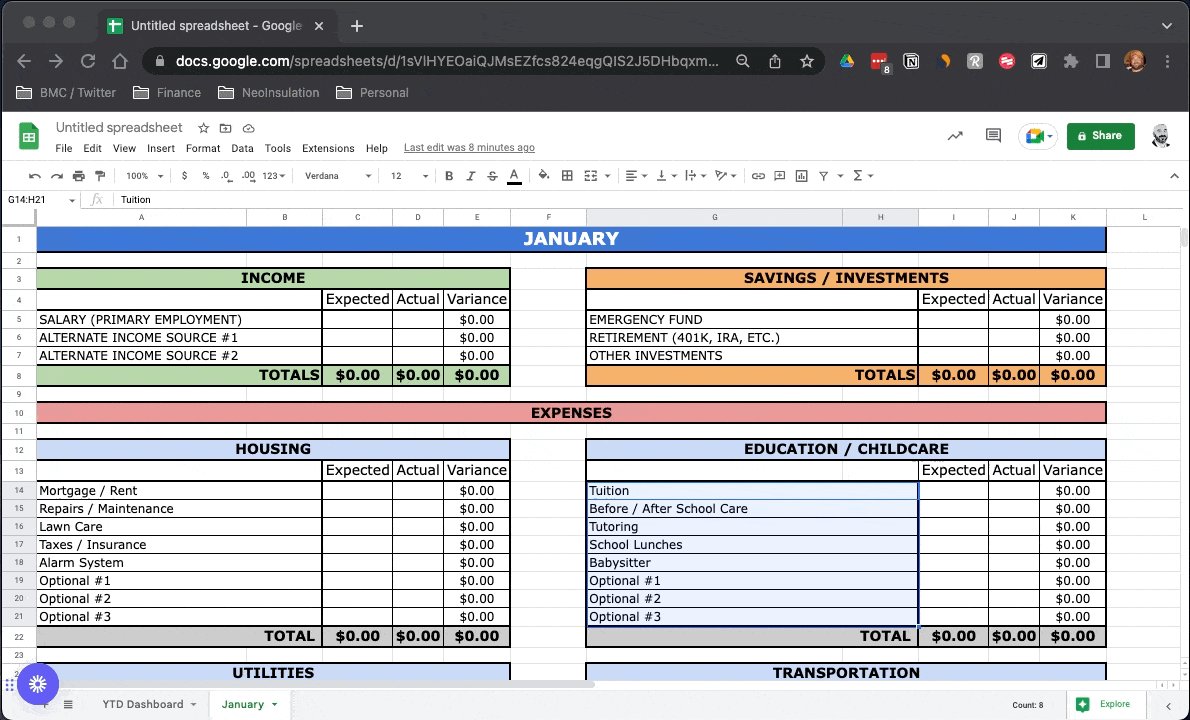
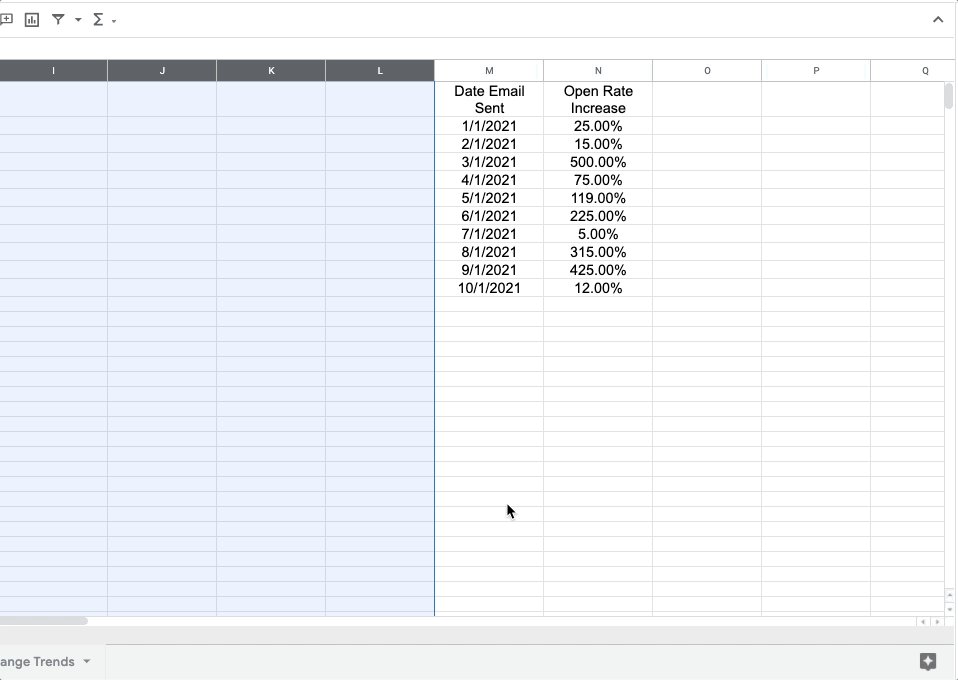
Need to do some number crunching?
Let Google's AI do the work for you.
•Highlight the range of data.
•Move your cursor to the starburst shaped icon in the bottom right corner.
•Click "Explore" – Complex charts, analytics, & detailed info. generated automatically.
https://t.co/vC0nCFDmk0
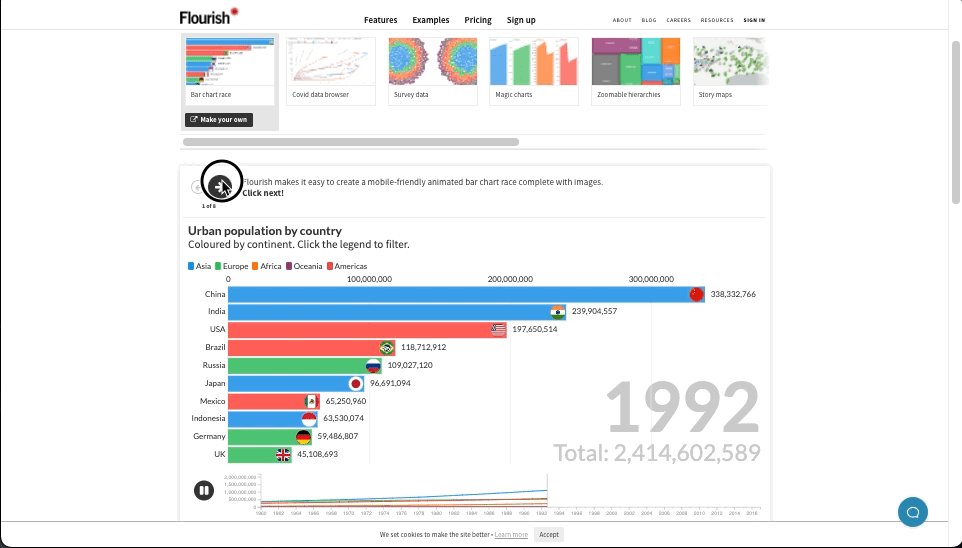
People are visual learners.
Easily turn your data into stunning charts, maps, and interactive stories.
Upload a spreadsheet, and return with:
• Animated bar charts
• Survey data
• Scatter plots
• Story maps & more
https://t.co/g9YBl2ELwq
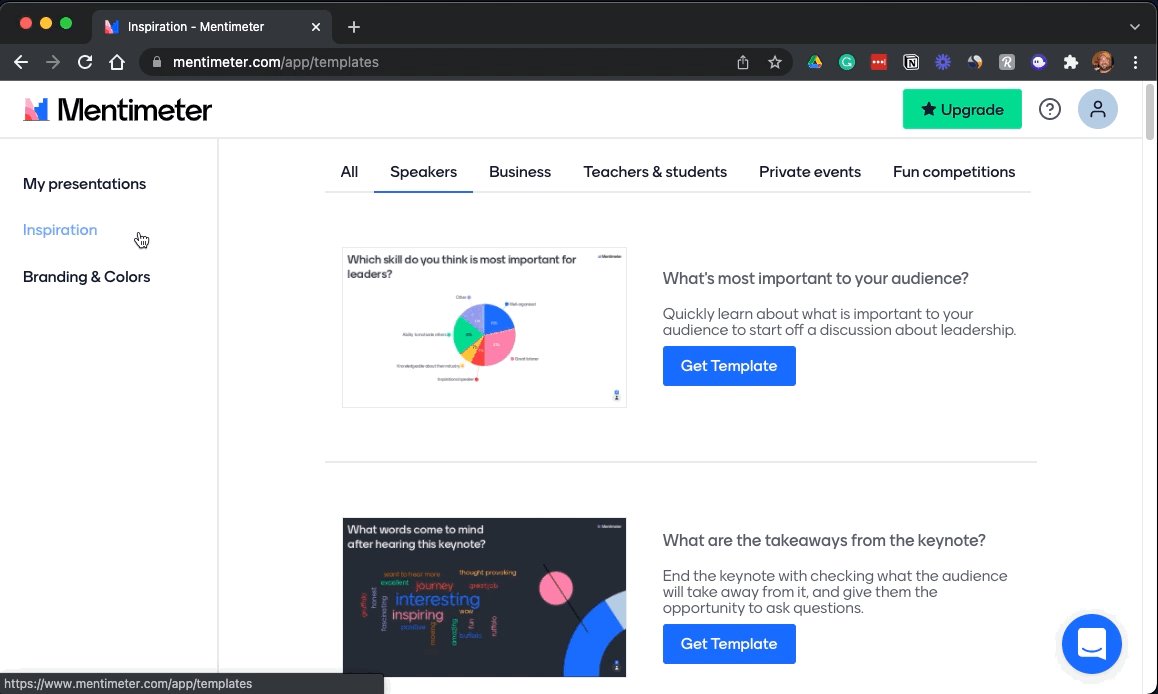
Looking for a way to make your presentations more engaging?
Build interactive polls, quizzes, and more allowing your audience to engage in real-time.
Using their smartphone, attendees can answer questions and the results are visualized as they happen.
https://t.co/wsUNfyHzFb
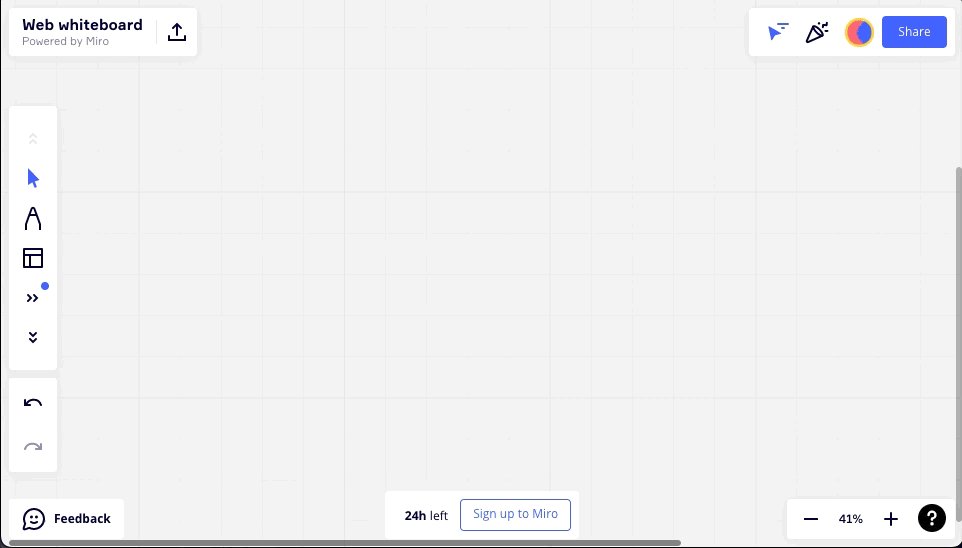
An online collaborative whiteboard ideal for remote meetings, brainstorming, and ideation across teams.
• Make flowcharts
• Build product roadmaps
• Engage in a quick retrospective
The best part?
It's free.
https://t.co/RxDEsvPB2w
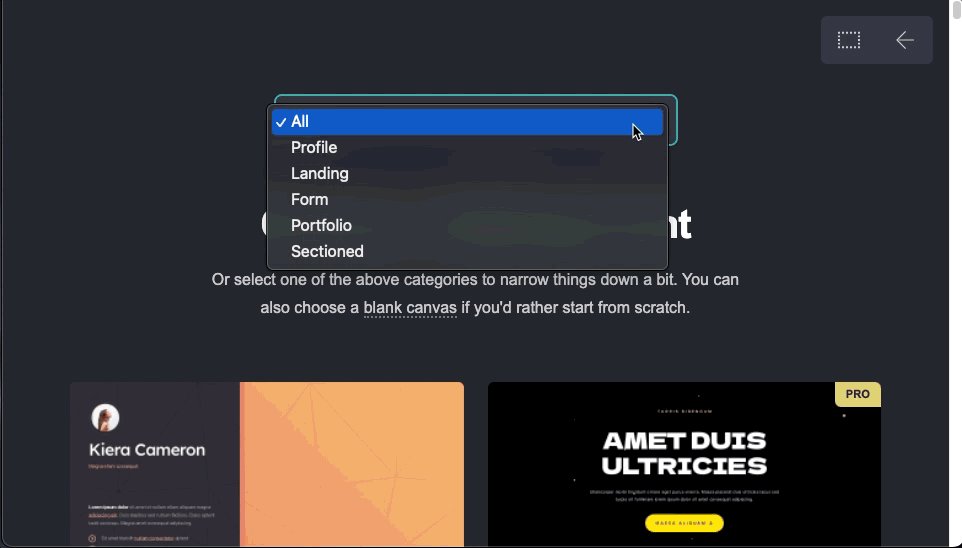
My friend @thejustinwelsh brought this site to my attention recently.
If you're in the solopreneur game and need to spin up a quick landing page or website for just about anything, Carrd is tough to beat.
Simple, free, mobile responsive.
Check 'em out.
