
DP are private exchanges for trading that are not accessible by the investing public. DP came about primarily to facilitate block trading by institutional investors who did not wish to impact the markets with their large orders and obtain worse prices for their trades.
THREAD on @Tradytics
Let me start by saying I do get a small kickback on every referral but I only do this for services I use, trust and love. In the following thread I’ll go over what my favorite features are and how I use them.
•
Sign up @ https://t.co/dO4RSNuQfH for 10% off
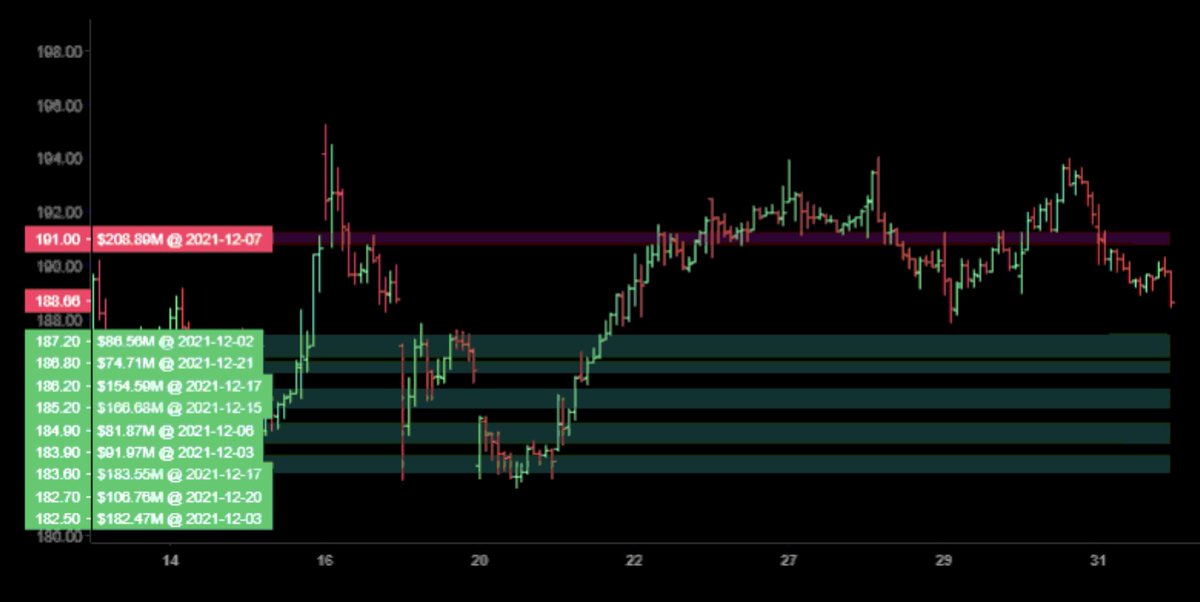
DP are private exchanges for trading that are not accessible by the investing public. DP came about primarily to facilitate block trading by institutional investors who did not wish to impact the markets with their large orders and obtain worse prices for their trades.
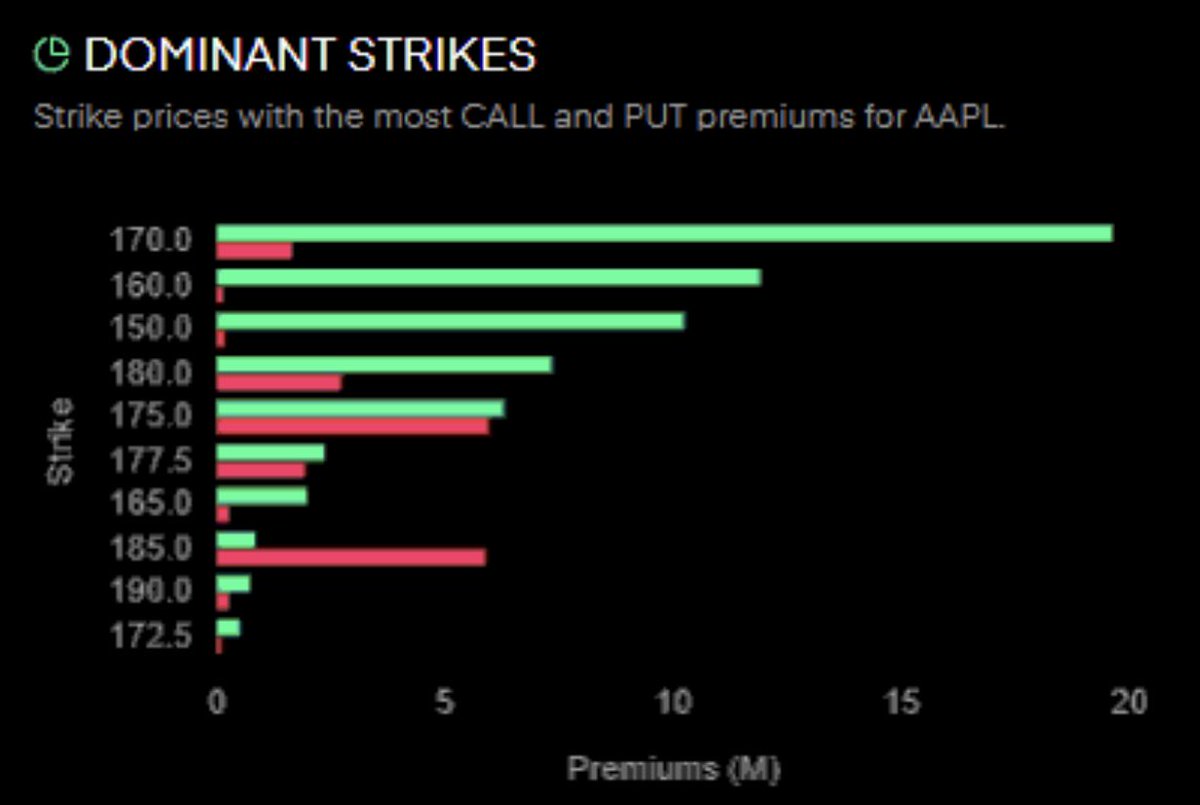
Levels. Levels. Levels. I use DarkPool as areas of support/resistance. Ideally I like to find stocks over (calls) or under(puts) large prints. These prints will help keep the stock moving the direction you want. These levels CAN break. See 👇🏼
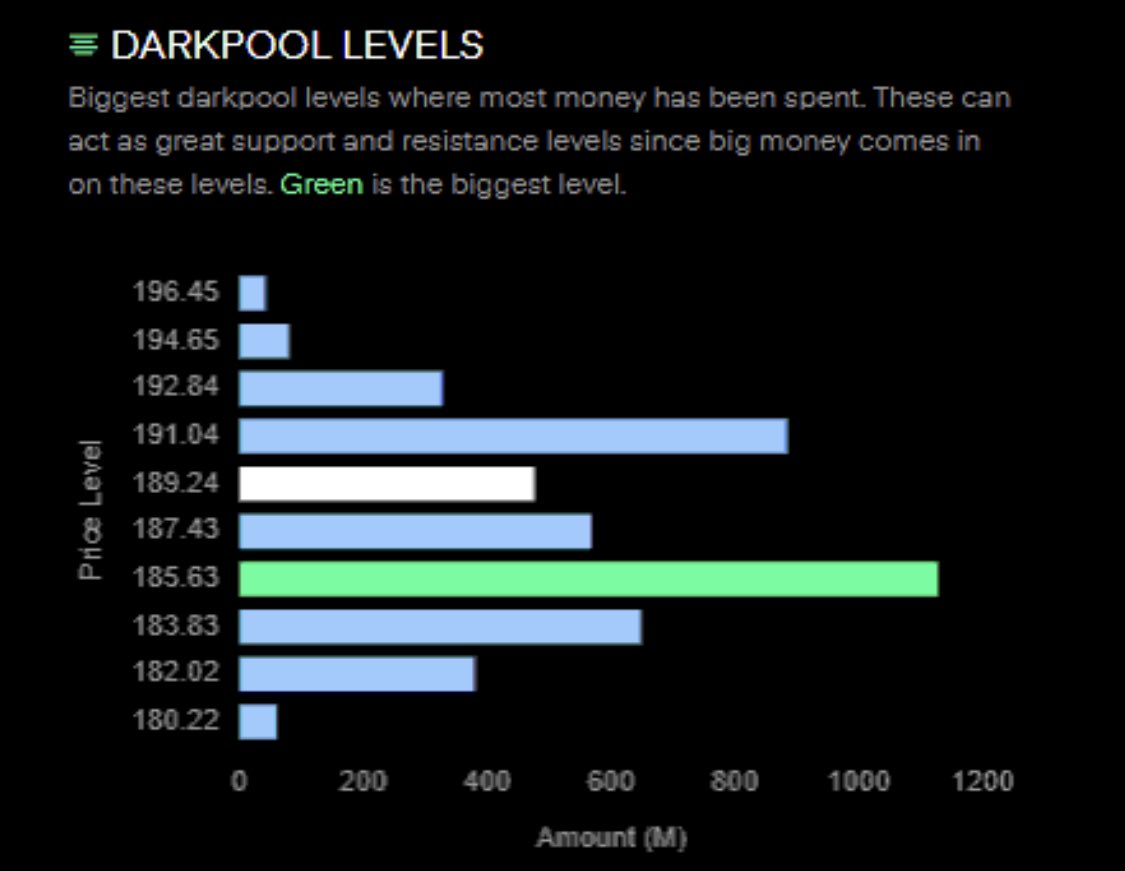
You can even scroll down on the site and find more information. It aggregates the prints into a DP levels chart, a graph showing the daily DP amounts and daily sentiment of those prints.
Because I constantly post Algoflow charts, I get asked how to interpret the chart all the time. Read this: https://t.co/mS4AMKyVW5
Still have questions about? Ask away…
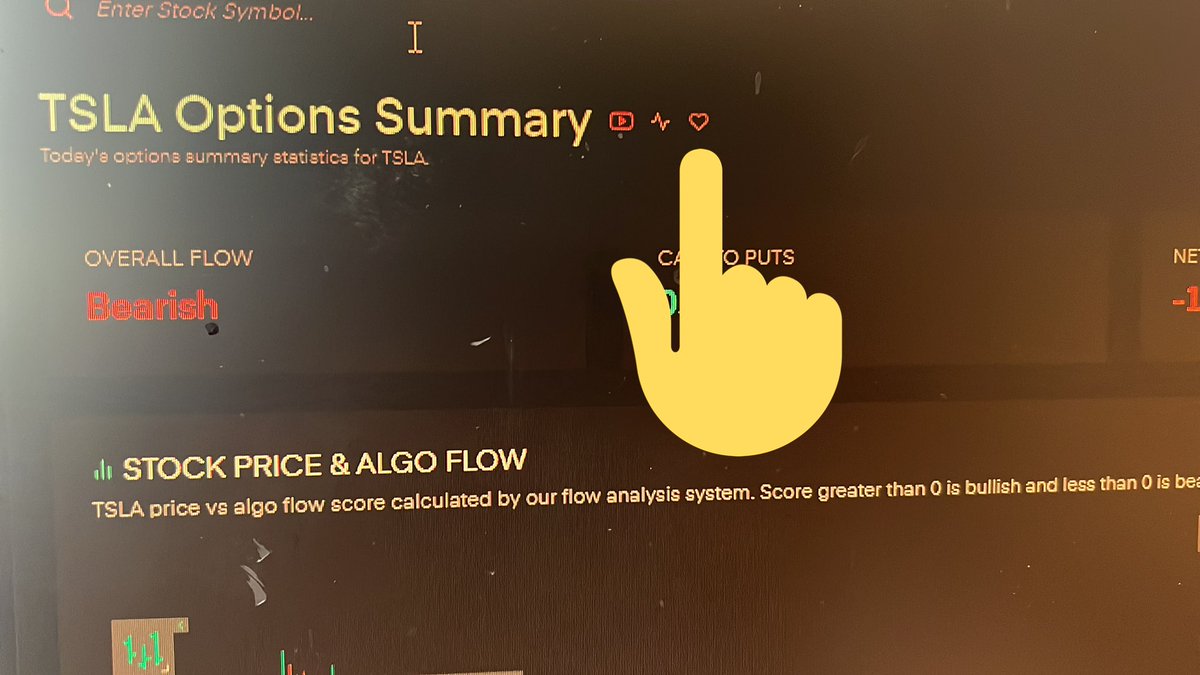
What I look for in Algoflows is divergence. The bigger the better. If it’s a cheaper stock I want at least a few dollar divergence. If it’s something like TSLA I want like a $40-50 divergence. Just because you are starting to see divergence doesn’t mean it’s bottomed.
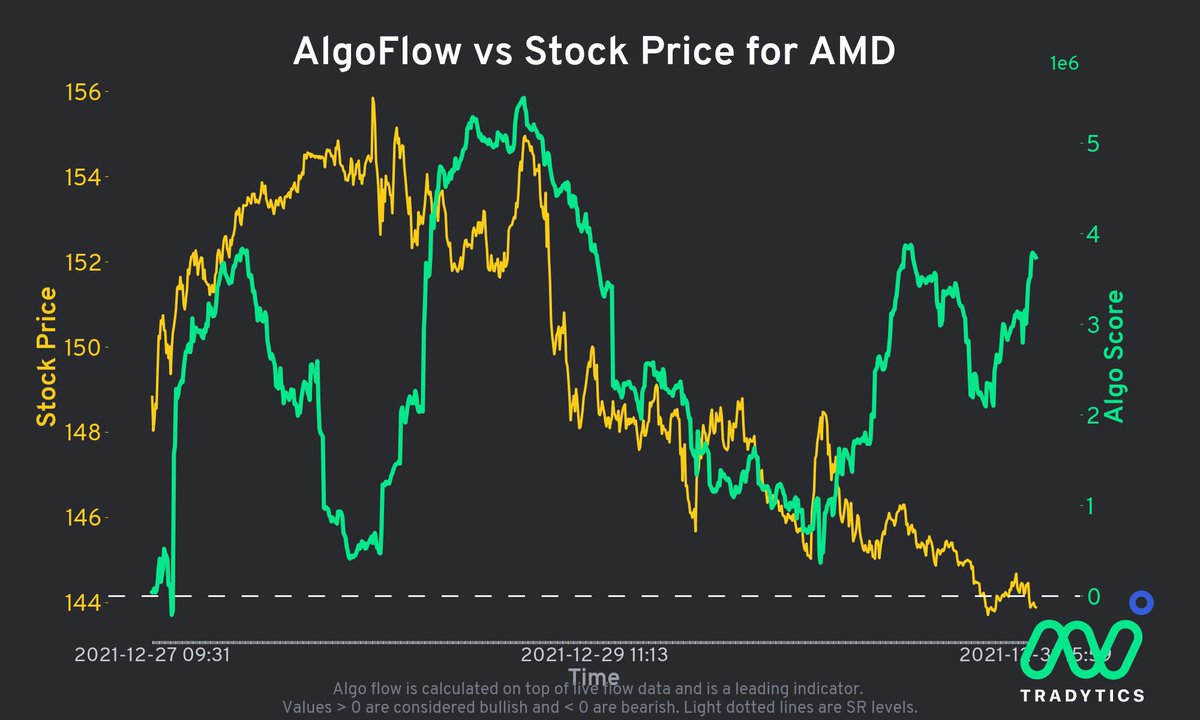
Find an area of support under where it’s trading. You can play it 2 ways, buy the dip at that level or find a small level above the dip & wait for that to confirm upward continuation. Likewise for puts, find a level of resistance & play the rejection back to AF line.
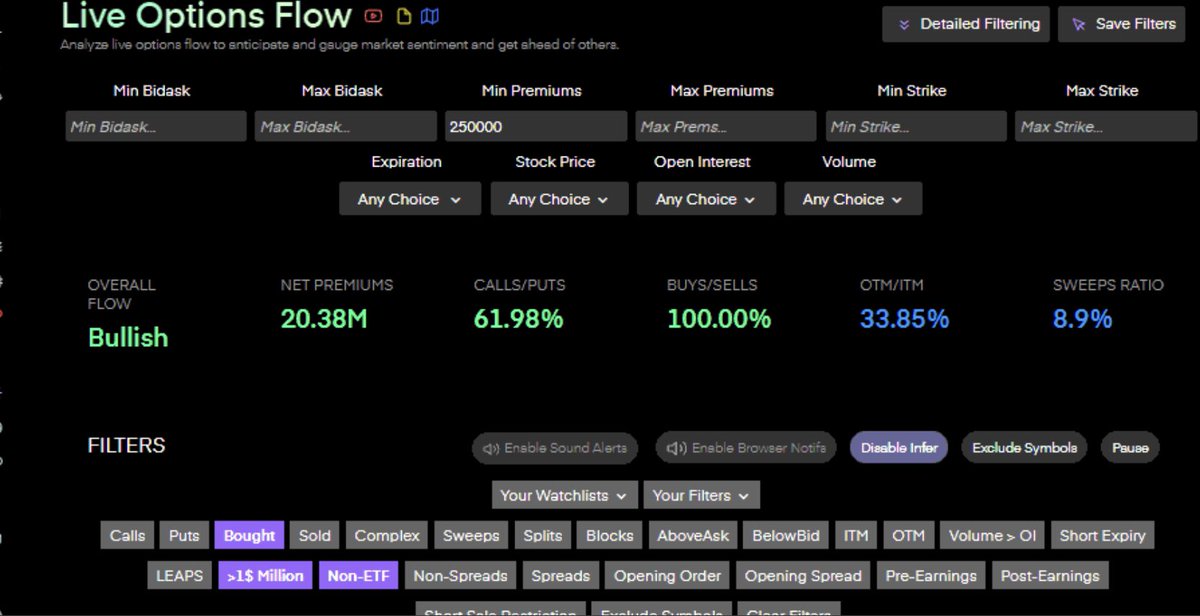
This is similar to many other “Flow” services. I like the customization of @Tradytics flow better. You can create different filters and then save them for easy back and forth. I often do this with premium size during the day. Switch between 50k-250k etc.

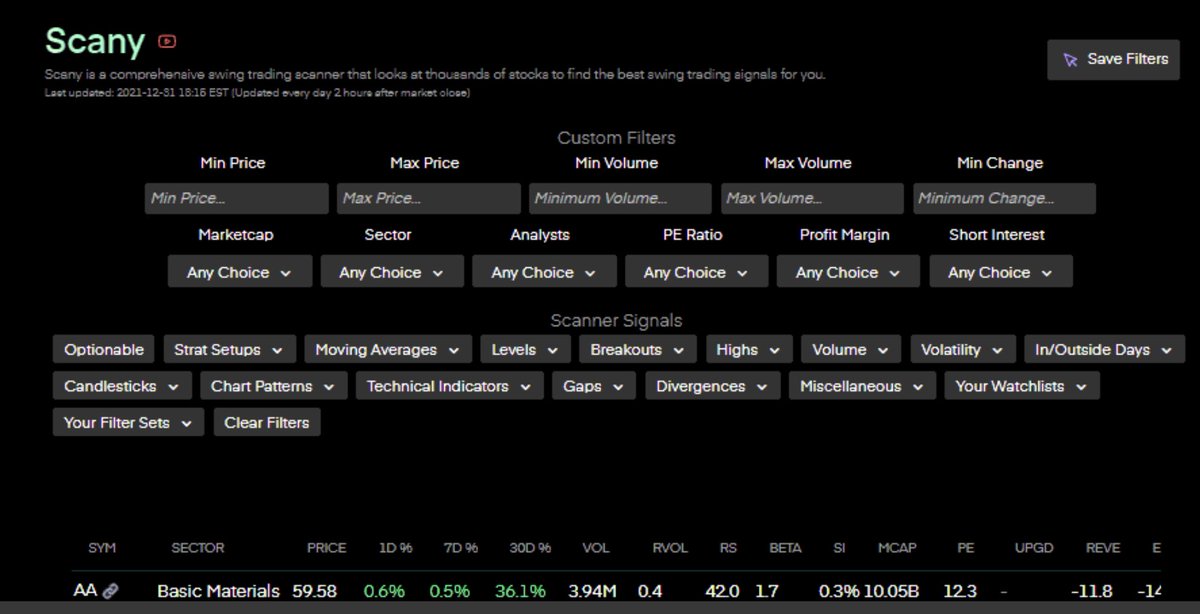
Sign up @ https://t.co/dO4RSNuQfH for 10% off
More from Tradingthread

A thread of my threads!

1. https://t.co/cWGjheFrdL
2. https://t.co/tgJO7riEYH
3. OFFERINGS
4. OPTIONS and WARRANTS
1. https://t.co/cWGjheFrdL
I\u2019m going to do a thread on \u201cDD\u201d. Due diligence is everything about investing. There\u2019s no wrong way to do DD, but I\u2019m going to show a few things I do in order to finding a company that I believe in. Also mix in what others do as well!
— Yates Investing (@yatesinvesting) May 16, 2020
2. https://t.co/tgJO7riEYH
Tonight I want to discuss \u201cGap Fills\u201d I was asked the other day what I meant, so I decided to do this thread.
— Yates Investing (@yatesinvesting) May 14, 2020
3. OFFERINGS
Alright, so tonight i\u2019m going to discuss offerings. I\u2019m also going to discuss why I think offerings are easy money makers. It\u2019s one of my trading strategies, but don\u2019t think that means you need to go buy every stock that has an offering. This might be long. Let\u2019s get started....
— Yates Investing (@yatesinvesting) May 12, 2020
4. OPTIONS and WARRANTS
Let\u2019s learn the difference between stock options and stock warrants real quick.
— Yates Investing (@yatesinvesting) May 12, 2020
Also want to go over option trading more.

So I'll give you a breakdown on which website I use to check my DD along with mainly using my PLATFORM as the MAIN source of information. But other websites are also used. . Then I will provide you with a youtuber whose name is RILEY ..
his content from the playlist start with "how to read stock charts". It's precise and on point and short enough for you to get through this week even if you did one video tonight .. I like his teaching method .. he's slow and very easy to understand
As for DD. It comes from many factors. Mainly the trading platform itself has updated news posted on the ticker you want to trade.
https://t.co/1f8wQs1LcA
Really liking this website it has breakdown of the financials & summary of SEC filings. (con'd)
Also a whole bunch of other stuff that it focuses on the companies that you search. As for what I look for?
10-K & 10-Q.
Read 8Ks ..company updates
Also look to see if they did an recent Offerings (S-4 filings)
Also look to see S-3 filings for upcoming dilutions.
cont'd
https://t.co/nxP0hAJ4UH (Great place for quick articles on many stocks that are posted by analysts who do very good work digging info)
https://t.co/KsYqlmTlQ8 for quick news info
https://t.co/v5xGZqWhbn For constant world news

A COMPLETE BREAKDOWN OF MY MOMENTUM DAY TRADING PROCESS.
[THREAD]
A process is just a set of rituals you complete consistently every single day to achieve a certain outcome (profit).
A process requires an edge which is simply a statistical advantage you have over other players. A strong psychological state can be considered a bonus edge.
I believe that trading can be split into three elements:
1) Knowledge and idea generation
2) Method and trade execution
3) Risk management and mindset
Each element is necessary and it builds a solid foundation in your trading process.
These factors make up the trading trinity.
MY SCANNING PROCESS:
In PM, I look for:
- Top gainers (40%+)
- Notable volume on gappers
- News or catalysts (to justify gap)
- Float (<50M)
- Market cap (<500M)
- Range (check daily)
- Price (<25)
- Stock personality (check daily)
- Filings (cash on hand and offering potential)
I like to use websites such as:
- https://t.co/dGrDjwtOR8
- https://t.co/Vc256oZCre
- https://t.co/AFrA2ebGr6
- https://t.co/N9nDmqz54E
- https://t.co/0aEt36amzx
- https://t.co/K5b5oercFQ
- https://t.co/VogPh4QNHM
-


It's time for a mega-thread (Updated).
This contains some of the best threads and articles on various topics related to trading, that I have posted till now.
Enjoy!😊
A thread on closing basis Stop
A thread on
Position
Trading
This contains some of the best threads and articles on various topics related to trading, that I have posted till now.
Enjoy!😊
A thread on closing basis Stop
I have been asked many times about my views on Closing basis Stop loss.
— Trader knight (@Traderknight007) November 5, 2021
So here's a thread on the same. pic.twitter.com/qFgujKAFqS
A thread on
Experience don't count in trading IMO, i can show you people who are trading from last 20 years and still losing money and i can also show you people who are in market since 3-4 years and are Profitable.
— Trader knight (@Traderknight007) June 25, 2021
What matters is how much time do you take to learn from a mistake,
Position
90% of the difference between the performance of a super trader and a normal joe is due to the position sizing.
— Trader knight (@Traderknight007) July 3, 2021
In this article, we will learn why position sizing is important and how we can implement it by learning 3 effective position sizing techniques.https://t.co/gWS4Ifi4OJ
Trading
The biggest trading mistakes that cost me lakhs of Rupees.
— Trader knight (@Traderknight007) July 17, 2021
And the lessons that I learned from them. \U0001f447https://t.co/NCwMM8SVYz
You May Also Like

#sculpture #story -
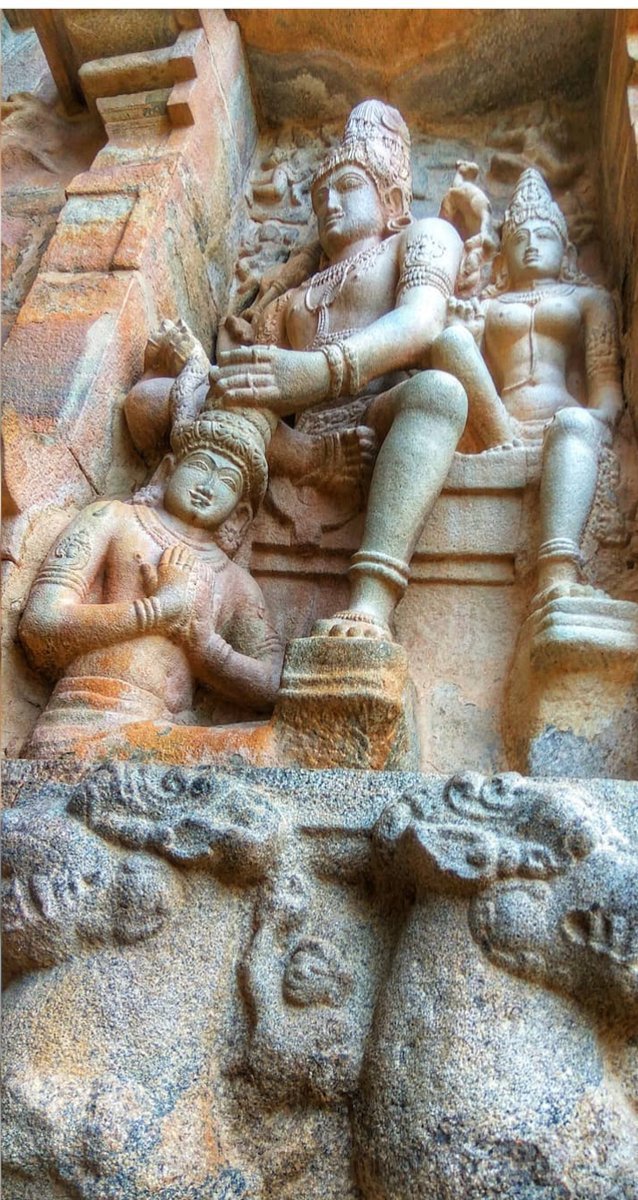
Chandesha-Anugraha Murti - One of the Sculpture in Brihadeshwara Temple at Gangaikonda Cholapuram - built by Raja Rajendra Chola I
This Sculpture depicts Bhagwan Shiva along with Devi Paravathi blessing Chandeshwara - one of the 63 Nayanmars.
#Thread
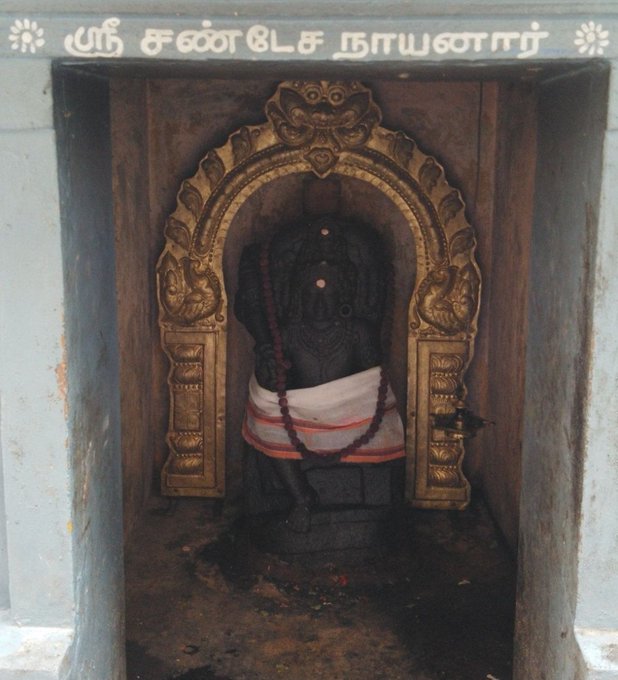
Chandeshwara/Chandikeshwara is regarded as custodian of Shiva Temple's wealth&most of Shiva temples in South India has separate sannathi for him.
His bhakti for Bhagwan Shiva elevated him as one of foremost among Nayanmars.
He gave importance to Shiva Pooja&protection of cows.
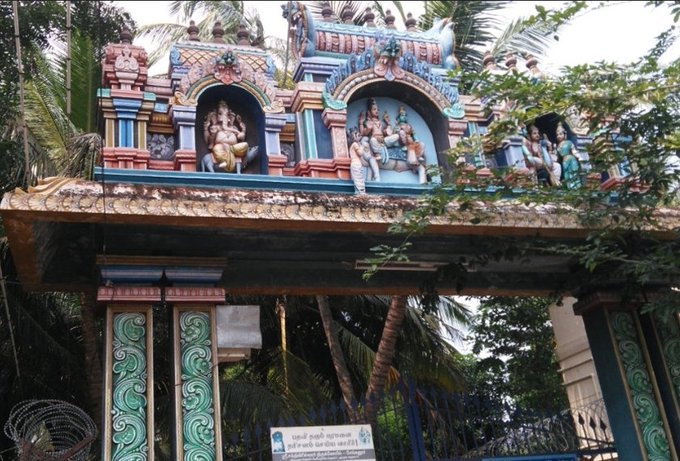
There are series of paintings, illustrating the #story of Chandikeshwar in the premises of
Sri Sathiyagireeswarar #Temple at Seinganur,near Kumbakonam,TN
Chandikeshwara's birth name
is Vichara sarman.He was born in the village of Senganur on the banks of River Manni.
His Parent names were Yajnathatan and Pavithrai.
Vichara Sarman was a gifted child and he learnt Vedas and Agamas at a very young age.
He was very devout and would always think about Bhagwan Shiva.
One day he saw a cowherd man brutally assaulting a cow,Vichara Sarman could not tolerate this. He spoke to cowherd: ‘Do you not know that the cow is worshipful & divine? All gods & Devas reside in https://t.co/ElLcI5ppsK it is our duty to protect cows &we should not to harm them.

Chandesha-Anugraha Murti - One of the Sculpture in Brihadeshwara Temple at Gangaikonda Cholapuram - built by Raja Rajendra Chola I
This Sculpture depicts Bhagwan Shiva along with Devi Paravathi blessing Chandeshwara - one of the 63 Nayanmars.
#Thread
Chandeshwara/Chandikeshwara is regarded as custodian of Shiva Temple's wealth&most of Shiva temples in South India has separate sannathi for him.
His bhakti for Bhagwan Shiva elevated him as one of foremost among Nayanmars.
He gave importance to Shiva Pooja&protection of cows.
There are series of paintings, illustrating the #story of Chandikeshwar in the premises of
Sri Sathiyagireeswarar #Temple at Seinganur,near Kumbakonam,TN
Chandikeshwara's birth name
is Vichara sarman.He was born in the village of Senganur on the banks of River Manni.
His Parent names were Yajnathatan and Pavithrai.
Vichara Sarman was a gifted child and he learnt Vedas and Agamas at a very young age.
He was very devout and would always think about Bhagwan Shiva.
One day he saw a cowherd man brutally assaulting a cow,Vichara Sarman could not tolerate this. He spoke to cowherd: ‘Do you not know that the cow is worshipful & divine? All gods & Devas reside in https://t.co/ElLcI5ppsK it is our duty to protect cows &we should not to harm them.
![Peter McCormack [Jan/3\u279e\u20bf \U0001f511\u220e]](https://pbs.twimg.com/profile_images/1524287442307723265/_59ITDbJ_normal.jpg)


Nano Course On Python For Trading
==========================
Module 1
Python makes it very easy to analyze and visualize time series data when you’re a beginner. It's easier when you don't have to install python on your PC (that's why it's a nano course, you'll learn python...
... on the go). You will not be required to install python in your PC but you will be using an amazing python editor, Google Colab Visit https://t.co/EZt0agsdlV
This course is for anyone out there who is confused, frustrated, and just wants this python/finance thing to work!
In Module 1 of this Nano course, we will learn about :
# Using Google Colab
# Importing libraries
# Making a Random Time Series of Black Field Research Stock (fictional)
# Using Google Colab
Intro link is here on YT: https://t.co/MqMSDBaQri
Create a new Notebook at https://t.co/EZt0agsdlV and name it AnythingOfYourChoice.ipynb
You got your notebook ready and now the game is on!
You can add code in these cells and add as many cells as you want
# Importing Libraries
Imports are pretty standard, with a few exceptions.
For the most part, you can import your libraries by running the import.
Type this in the first cell you see. You need not worry about what each of these does, we will understand it later.