
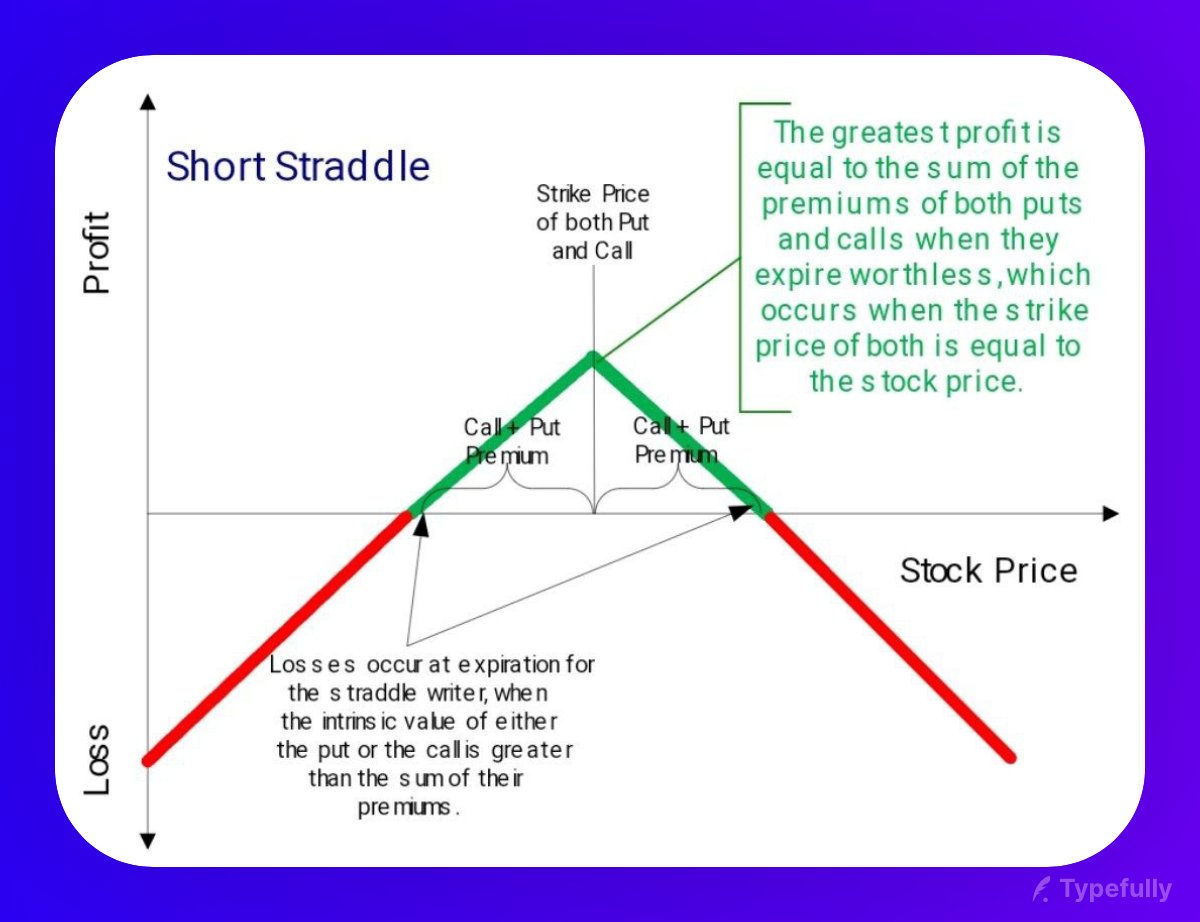
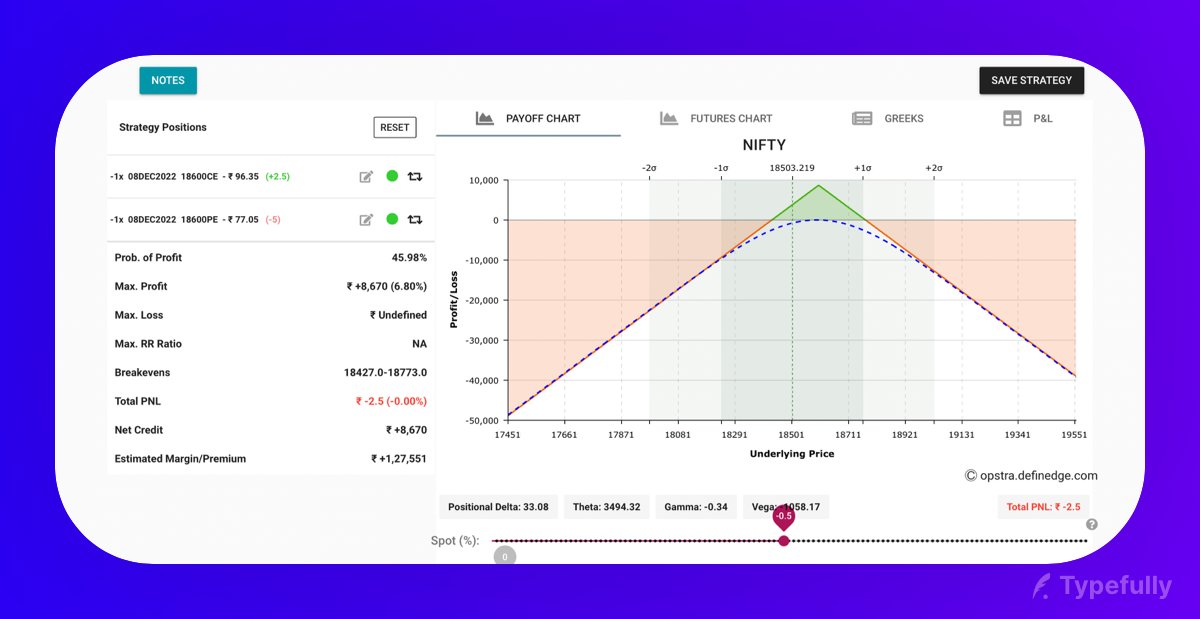
Where a call option and a put option are sold at the same strike price.
Traders often overlook the SHORT STRADDLE due to its simplicity.
It remains the TOP strategy to make money when the market is not trending.
Here's how you can make money using only the short straddle
in various market conditions
⬇️ A comprehensive thread🧵
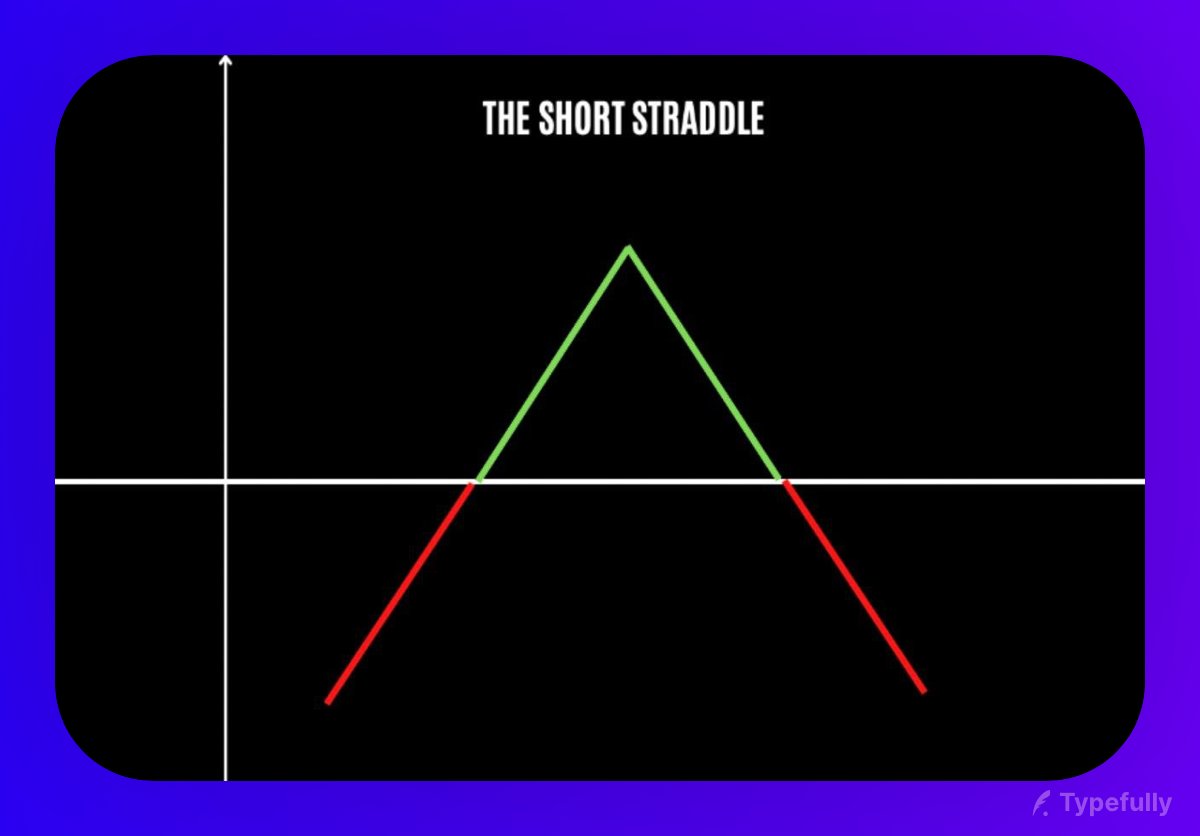
Where a call option and a put option are sold at the same strike price.
Max risk = Unlimited
(using SLs would be wise)
Upper breakeven = Strike price + Total Premium received
Lower breakeven = Strike price - Total Premium received
Long-term short straddles usually require fewer adjustments since the range is wide.
You will have to define your criteria based on your risk appetite and the gap between the breakevens.
Ex:- gap between the breakevens is 360 points, so I would prefer making adjustments on every 50-point move.
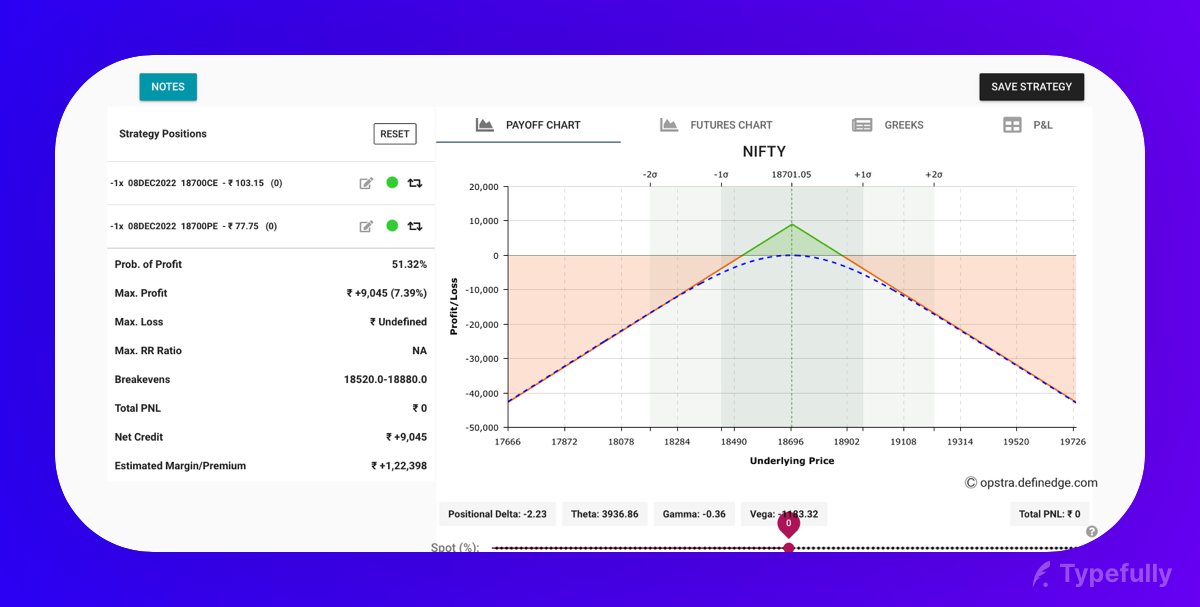
Suppose the straddle is initially made at 18700 strike price, then,
NIFTY moves up to 18794 ( 94 points from our strike price/ max profit point )
The trader can now create a new straddle at 19000 strike price.
Which provides a larger range

Initial strike price ± 2*(Movement)
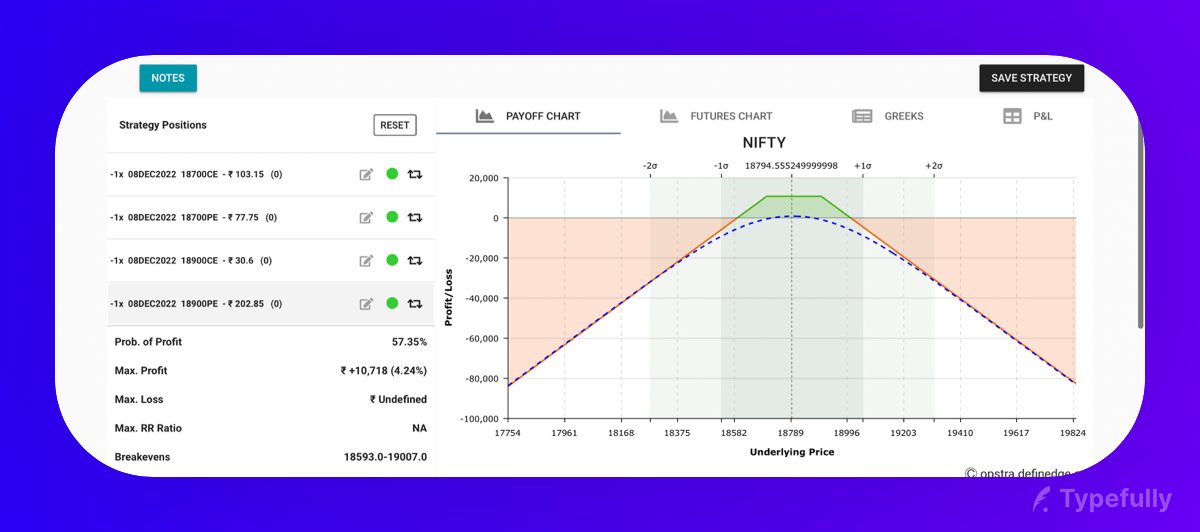
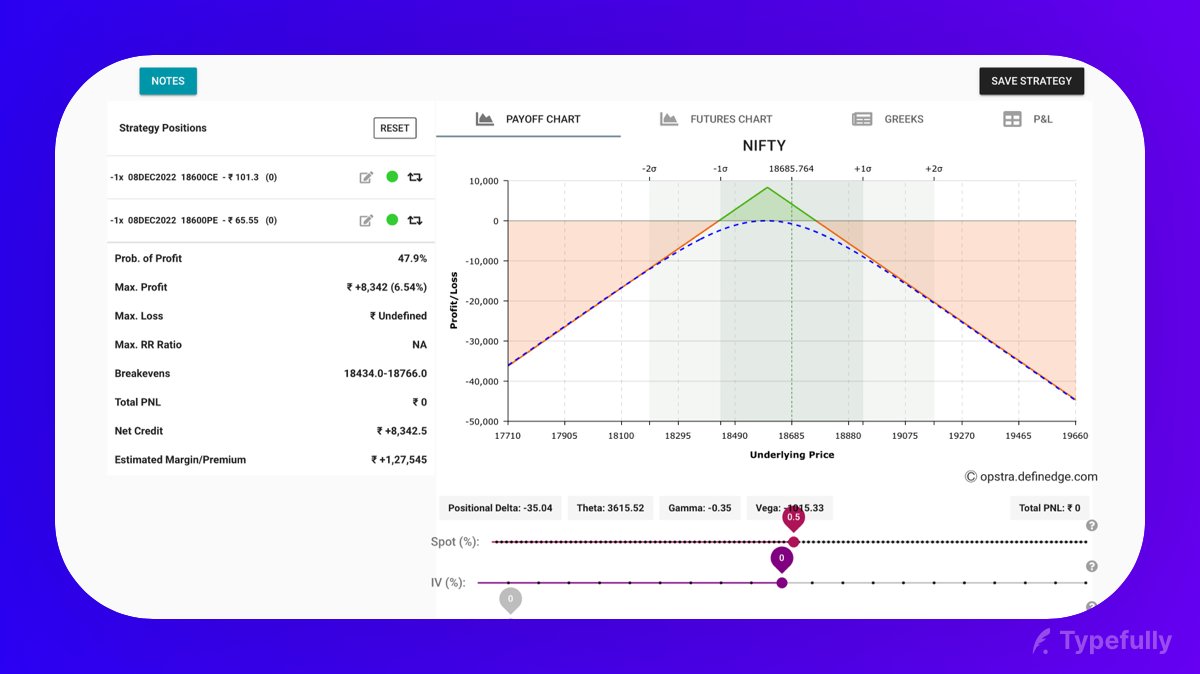
In the given example,
NIFTY has shifted to 18499 from our strike price of 18600 (101 points)
The trader can sell a call option for wider range
If the underlying moves drastically in any direction,
The trader can book his profit/loss in the straddle and initiate a new one after the market is relatively calm

NIFTY has moved up by 86 points
We can keep the square off the short call option(at a loss)
and we can
1) Put an SL on the put leg (this would make it a directional trade)
or
2) We can sell a 18850 CE to create a strangle
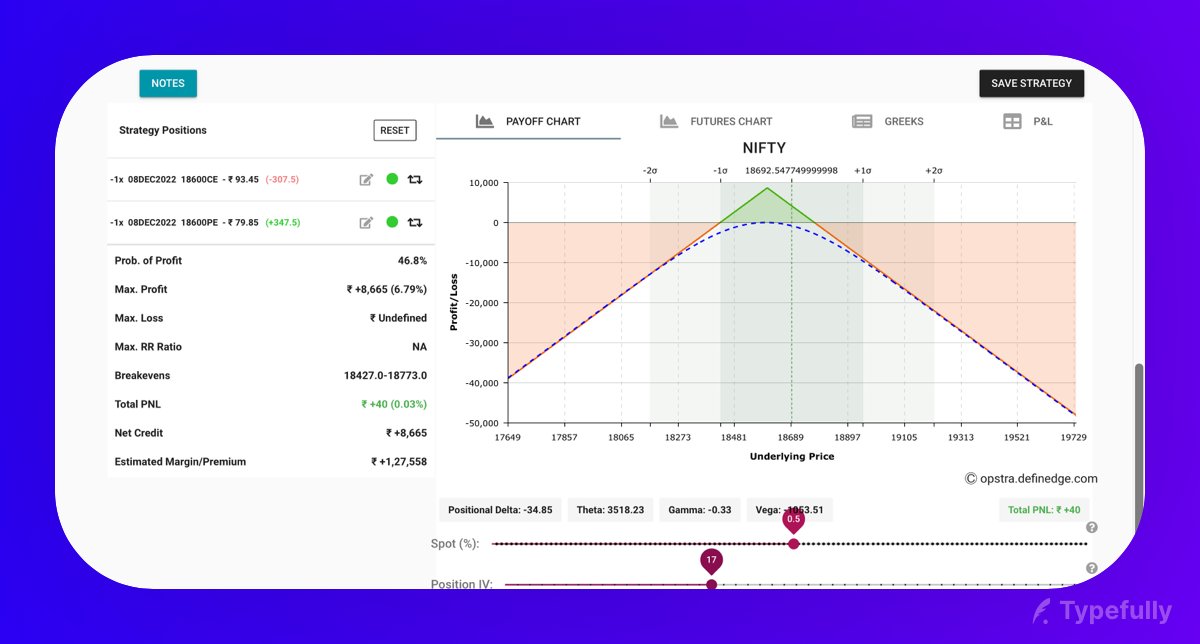
In the below example,
NIFTY has moved 92 points from our strike price
We can buy 18850 CE to reduce the risk on the upper side.

• For profit booking, trailing stop loss is suggested so that maximum points can be extracted from the straddle
• If one has lost over 2% of his/her total capital, he/she should probably terminate the strategy and book the loss.
Where I share live trading and market-related updates, you can join my FREE TELEGRAM CHANNEL by clicking on the link below. 👇
https://t.co/GHfoJevtw1
Follow me @mohitsharmadl for more.
Like/Retweet 👍 the first tweet below if you can: https://t.co/xo8VsfeQu9
Traders often overlook the SHORT STRADDLE due to its simplicity.
— Mohit Sharma (@mohitsharmadl) December 9, 2022
It remains the TOP strategy to make money when the market is not trending.
Here's how you can make money using only the short straddle
in various market conditions
\u2b07\ufe0f A comprehensive thread\U0001f9f5 pic.twitter.com/inHebjXzZA
More from Trading


You May Also Like


Took me 5 years to get the best Chartink scanners for Stock Market, but you’ll get it in 5 mminutes here ⏰
Do Share the above tweet 👆
These are going to be very simple yet effective pure price action based scanners, no fancy indicators nothing - hope you liked it.
https://t.co/JU0MJIbpRV
52 Week High
One of the classic scanners very you will get strong stocks to Bet on.
https://t.co/V69th0jwBr
Hourly Breakout
This scanner will give you short term bet breakouts like hourly or 2Hr breakout
Volume shocker
Volume spurt in a stock with massive X times


1/OK, data mystery time.
This New York Times feature shows China with a Gini Index of less than 30, which would make it more equal than Canada, France, or the Netherlands. https://t.co/g3Sv6DZTDE
That's weird. Income inequality in China is legendary.
Let's check this number.
2/The New York Times cites the World Bank's recent report, "Fair Progress? Economic Mobility across Generations Around the World".
The report is available here:
3/The World Bank report has a graph in which it appears to show the same value for China's Gini - under 0.3.
The graph cites the World Development Indicators as its source for the income inequality data.

4/The World Development Indicators are available at the World Bank's website.
Here's the Gini index: https://t.co/MvylQzpX6A
It looks as if the latest estimate for China's Gini is 42.2.
That estimate is from 2012.
5/A Gini of 42.2 would put China in the same neighborhood as the U.S., whose Gini was estimated at 41 in 2013.
I can't find the <30 number anywhere. The only other estimate in the tables for China is from 2008, when it was estimated at 42.8.
This New York Times feature shows China with a Gini Index of less than 30, which would make it more equal than Canada, France, or the Netherlands. https://t.co/g3Sv6DZTDE
That's weird. Income inequality in China is legendary.
Let's check this number.
2/The New York Times cites the World Bank's recent report, "Fair Progress? Economic Mobility across Generations Around the World".
The report is available here:
3/The World Bank report has a graph in which it appears to show the same value for China's Gini - under 0.3.
The graph cites the World Development Indicators as its source for the income inequality data.
4/The World Development Indicators are available at the World Bank's website.
Here's the Gini index: https://t.co/MvylQzpX6A
It looks as if the latest estimate for China's Gini is 42.2.
That estimate is from 2012.
5/A Gini of 42.2 would put China in the same neighborhood as the U.S., whose Gini was estimated at 41 in 2013.
I can't find the <30 number anywhere. The only other estimate in the tables for China is from 2008, when it was estimated at 42.8.