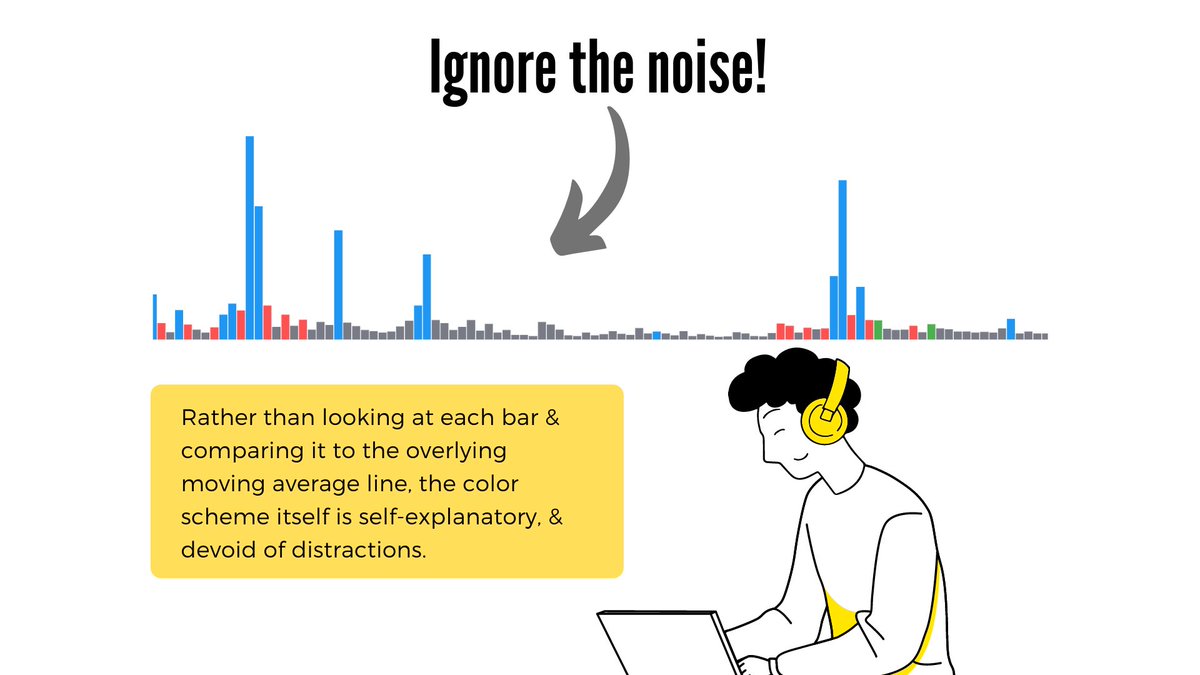
Here is the Chartink dashboard with moving averages plotted on total count of stocks above a certain moving average.
Further the count deviates from its moving average, weaker the move becomes.
More from Nitin R


More from Trading screeners

Chartink Screeners Complete Compilation
Sharing 9 Screeners🧵
1. Swing Trading Techno Funda https://t.co/sV6e8XSFRK
2.Range Breakout
https://t.co/SNKEpGHNtv
3. Stocks in Tight Range :
https://t.co/MqDFMEfj82
Telegram Link : https://t.co/b4N4oPjqm9
Retweet and Share !
4.Stock Closing up 3% Since 3 days
https://t.co/vLGG9k3YKz
5. Close above 21 ema
https://t.co/fMZkgLczxR
6. Days Fall and Reversal
7. 52 WEEK high Stocks.
https://t.co/H6Z6IGMRwS
8. Intraday Stocks :https://t.co/JoXYRcogj7
9. Darvas Box


A Gap Open is a Big Headache for Intraday Traders.
Nowadays everyday market is opening with big gaps.
Solution?
Shifting to Stocks!
But How to Pick Good Stocks for Tomorrow's Trading?
Presenting 11 FREE Screeners to scan Stocks for the Next Trading Day!
Thread 🧵
(1/N)
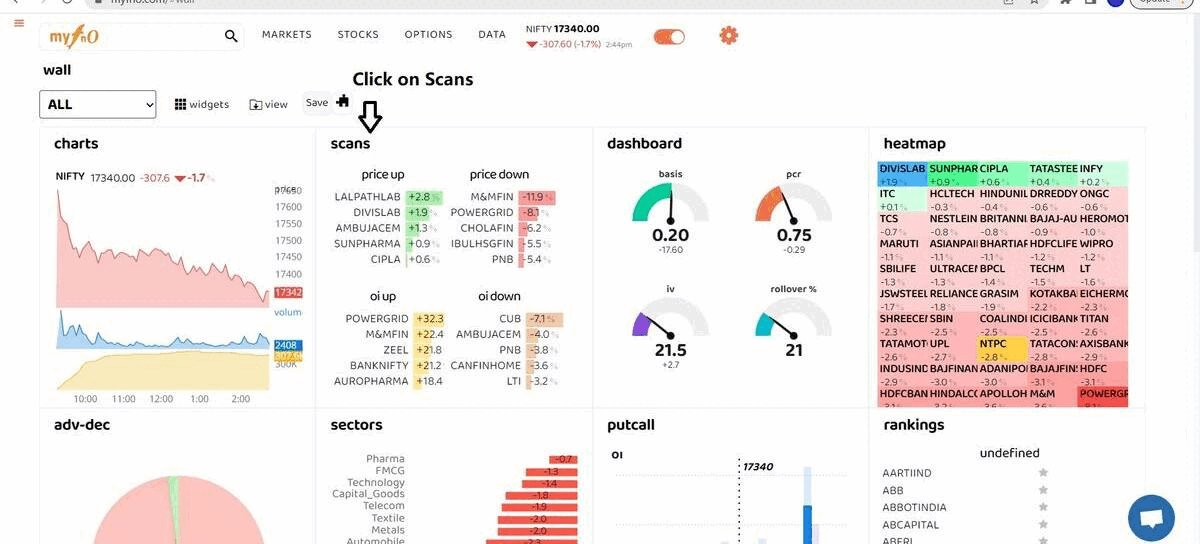
MYFNO - To Know the Stocks Which Received High and Low Open Interest (OI)
https://t.co/FURZDTArKK
(2/N)
Shortlist Bullish Momentum Stocks
This Screener shortlists all the bullish momentum stocks from NSE for the next day's trading (based on price action).
https://t.co/3teN7JLDMs
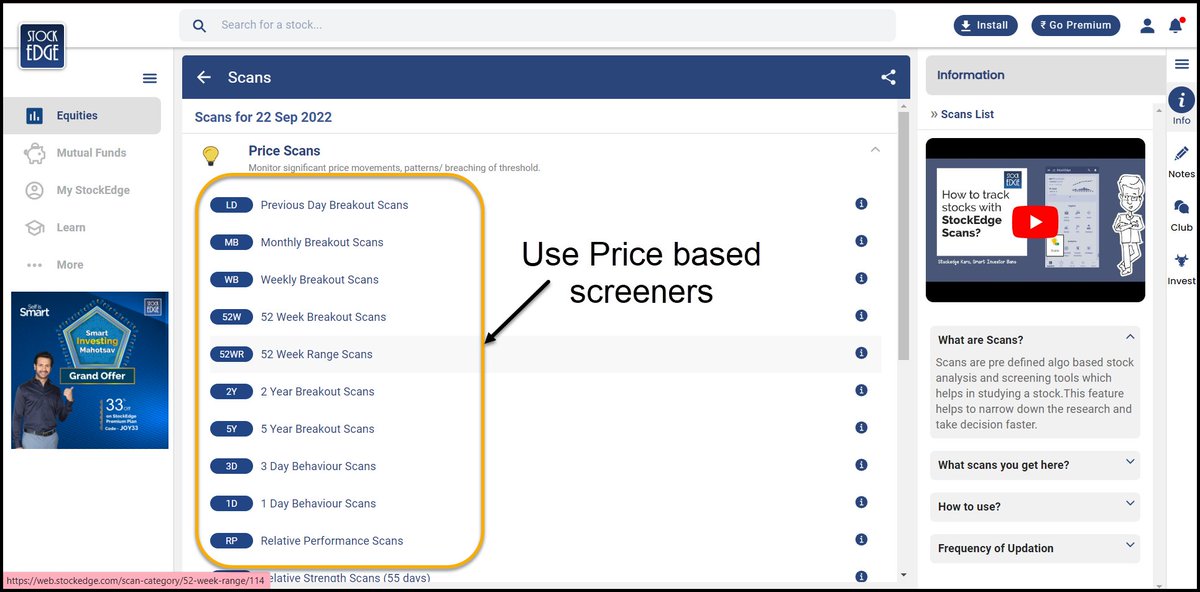
(3/N)
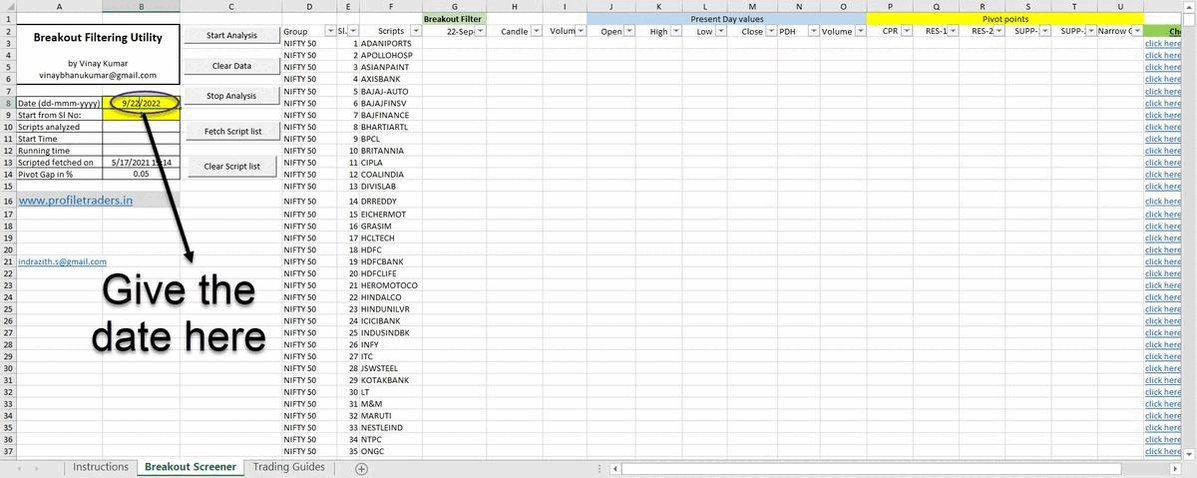
Screeners Based on Price (ex: Previous Day Breakout, Weekly Breakout, Monthly Breakout, etc.)
https://t.co/Y5naQIx967
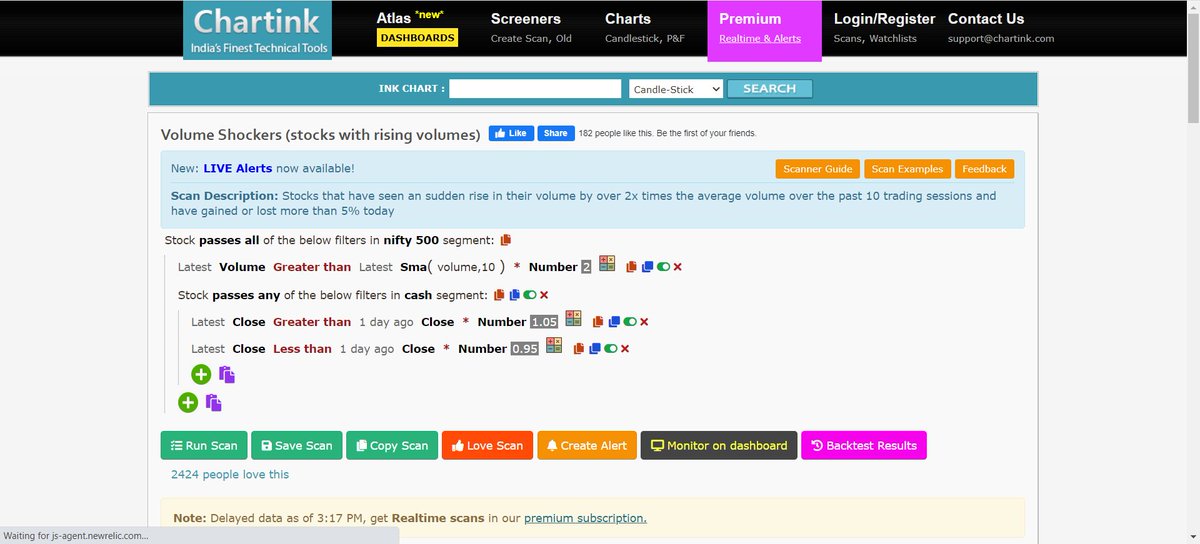
(4/N)
Volume Shockers - Stocks that received a huge volume
https://t.co/u9LTY5Yiir
(5/N)
Nowadays everyday market is opening with big gaps.
Solution?
Shifting to Stocks!
But How to Pick Good Stocks for Tomorrow's Trading?
Presenting 11 FREE Screeners to scan Stocks for the Next Trading Day!
Thread 🧵
(1/N)
MYFNO - To Know the Stocks Which Received High and Low Open Interest (OI)
https://t.co/FURZDTArKK
(2/N)
Shortlist Bullish Momentum Stocks
This Screener shortlists all the bullish momentum stocks from NSE for the next day's trading (based on price action).
https://t.co/3teN7JLDMs
(3/N)
Screeners Based on Price (ex: Previous Day Breakout, Weekly Breakout, Monthly Breakout, etc.)
https://t.co/Y5naQIx967
(4/N)
Volume Shockers - Stocks that received a huge volume
https://t.co/u9LTY5Yiir
(5/N)