https://t.co/MGKzygn1YW
So friends here is the thread on the recommended pathway for new entrants in the stock market.
Here I will share what I believe are essentials for anybody who is interested in stock markets and the resources to learn them, its from my experience and by no means exhaustive..
https://t.co/MGKzygn1YW

https://t.co/72M2DCPJHZ
https://t.co/uqJRvfkxb5
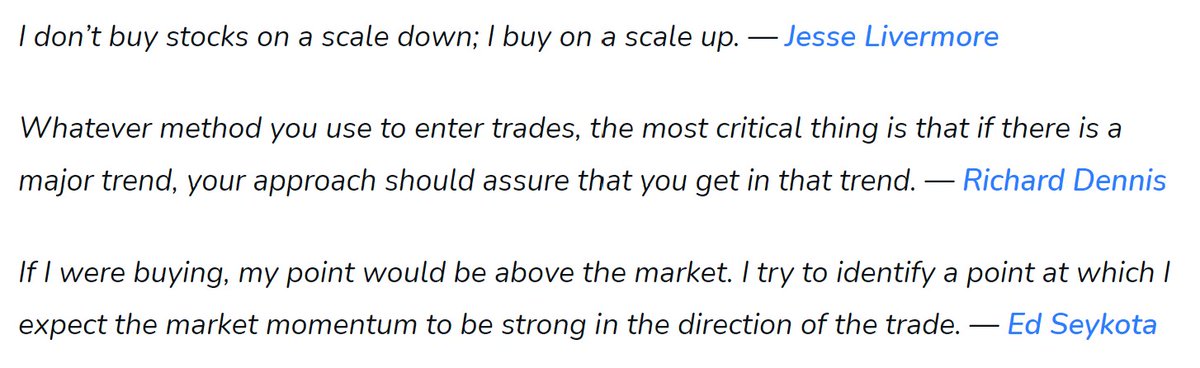
Old is Gold....
— Professor (@DillikiBiili) January 23, 2020
this Bharti Airtel chart is a true copy of the Wyckoff Pattern propounded in 1931....... pic.twitter.com/tQ1PNebq7d
First concepts to be learned are finding support and resistance on charts or price levels.
https://t.co/Q5njGt26zv
For breakouts, they are very very important !
https://t.co/kHK064D5z1
https://t.co/0qUaenJmAF
https://t.co/rWVkIEAphx
Here are most important ones.
https://t.co/KIITvSWsj0
This is his workbook on Technical Analysis https://t.co/2GrnycldWf
No need to buy expensive books on Technical Analysis.
Trend indicators : For direction and strength
Momentum indicators : For the speed of price movement
Volatility Indicators : For measuring fluctuations
Volume Indicators : For measuring strength of trend based on volume traded

Thanks @bbands for this excellent tool.
https://t.co/W0UatdqXRw

An indicator cheat sheet is here
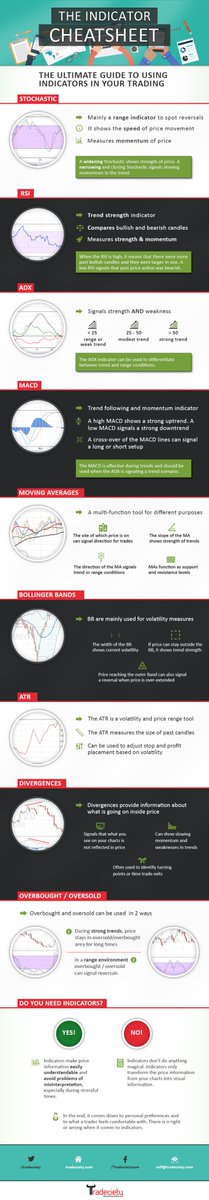
So once a person sees this light, he shifts to another gear increasingly trades on price Action, only occasionally taking support of indicators.
https://t.co/TSZXAMe196
Caution : These are only for advance readers.
Accumulation, Distribution and Breakouts are regular feature in markets. One or the other is always happening in some stocks.
In Roaring Bull markets, Breakouts increase as now a days we are seeing daily.
And the breakout may be in upside or downside both. If it happens after accumulation, it will be a bullish breakout and after distribution, it'll be bearish breakout.
I simple love breakouts.
https://t.co/2rCmYFK1Yr
More from Professor
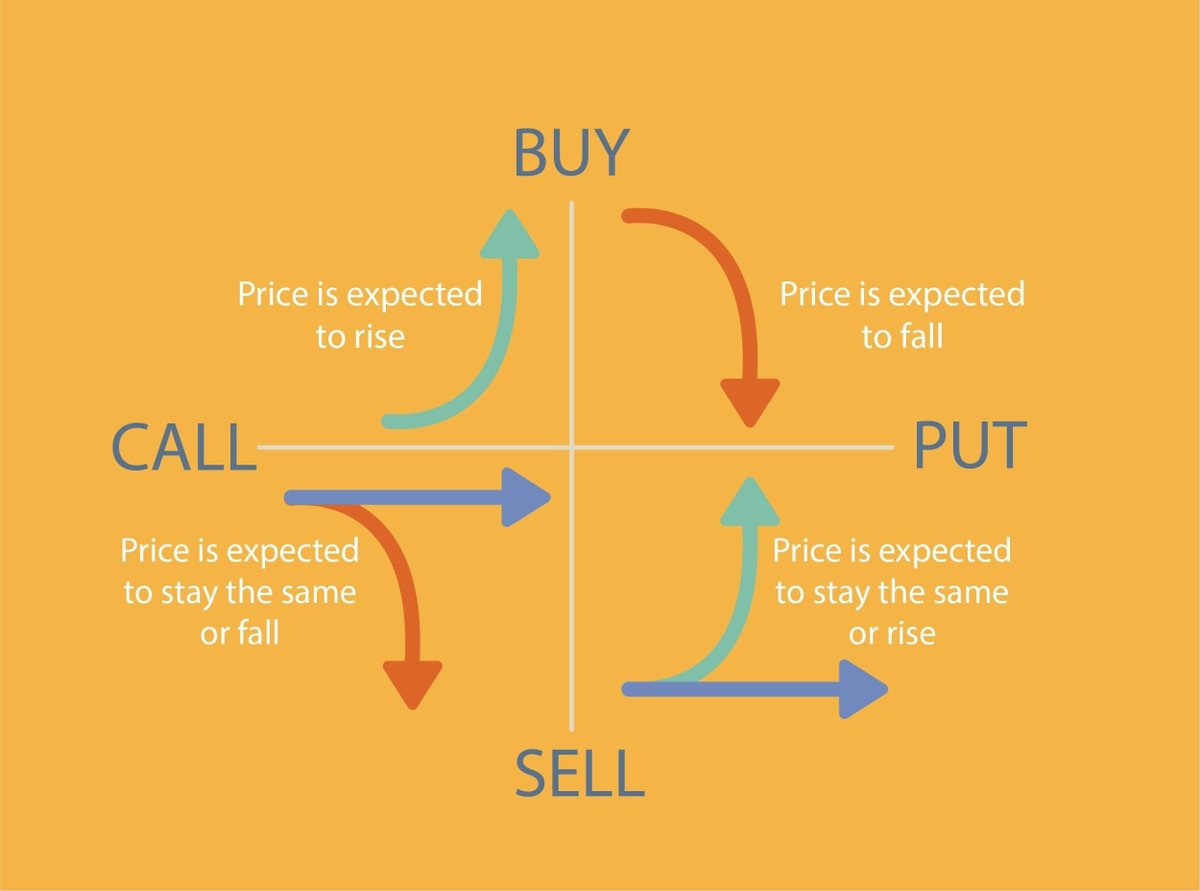
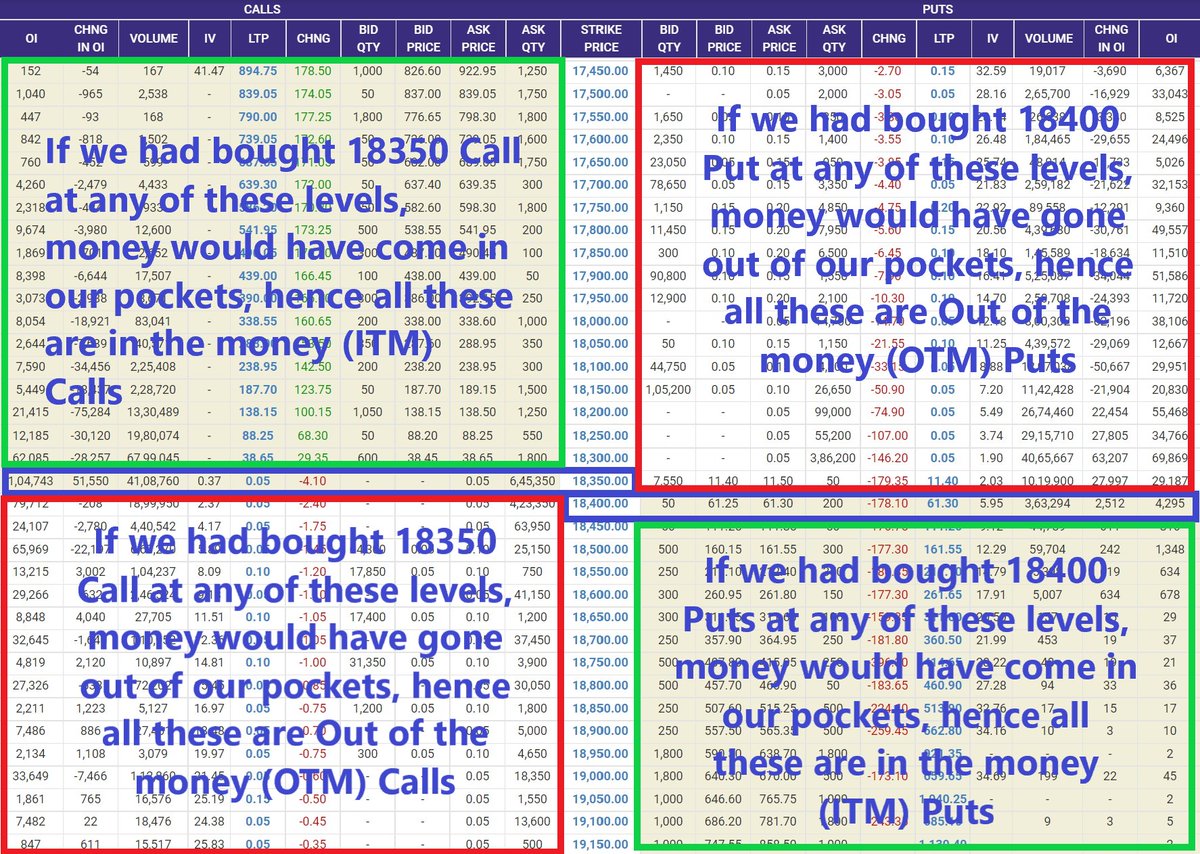
OI Data reading seekh lo:
See Large OIl buildup kin strikes par hai and in between strikes data kaise move ho raha hai.
Thumb Rule:
Calls Reduction + Puts addition = Upthrust
Calls Addition + Put Reduction = Down move
Higher the Delta OI velocity, faster is the move.
See Large OIl buildup kin strikes par hai and in between strikes data kaise move ho raha hai.
Thumb Rule:
Calls Reduction + Puts addition = Upthrust
Calls Addition + Put Reduction = Down move
Higher the Delta OI velocity, faster is the move.
For Nifty Intraday Traders: As of now, this seems to be a buy on dip market and looks like there won't be any juicy trades on short side. Will update if data changes. https://t.co/PCIyyPld4A pic.twitter.com/ES3o4z60rY
— Professor (@DillikiBiili) March 11, 2022
How to select good Breakout Trades:
Breakouts in the direction of the general trend
The longer the market is in a range, the stronger the breakout
Stock making higher lows near resistance zone
(lower highs near support zone is a sign of weakness)
Breakouts in the direction of the general trend
The longer the market is in a range, the stronger the breakout
Stock making higher lows near resistance zone
(lower highs near support zone is a sign of weakness)
Some ofthe biggest breakouts occur after Volatility Contraction, the analogy is that more a spring is pressed, higher it jumps whenever it gets released.
— Professor (@DillikiBiili) October 2, 2021
There is a VCP Scanner on chartink (Not mine). This may also be used to find potential Breakouts. pic.twitter.com/y1lmay7D4e