Hello Friends 🤗
Here is my filter to identify short term breakout in #stocks
Save it & Make a part of your trading tool
More from Stock Market Scientist™
Here are the links of some important threads of TA 📊 for new learners to study 😇😇
1️⃣Moving Avg
https://t.co/xbORdUm2MH
2️⃣Fibonacci
https://t.co/QS2FveTuF7
3️⃣Ichimoku
https://t.co/pITLA6IL9m
4️⃣Darvas Box Theory
https://t.co/PJ70uverV4
Happy Learning😇
Moving Averages Simplified\U0001f4d2
— Stock Market Scientist\u2122 (@MarketScientist) April 30, 2020
\U0001f535Its a technical indicator used by traders to identify trading opportunities
\U0001f535Its a Lagging indicator
\U0001f5352 MAs which traders use more often are..
SMA(Simple moving average) & EMA(Exponential moving average)
1/n#StockMarket #Technicals pic.twitter.com/ClDPEgVWZP
Here are the links of some important threads of TA 📊 to go through on holiday.
1️⃣Moving Avg
https://t.co/xbORdUm2MH
2️⃣Fibonacci
https://t.co/QS2FveTuF7
3️⃣Ichimoku
https://t.co/pITLA6IL9m
4️⃣Darvas Box Theory
https://t.co/PJ70uverV4
Happy Learning😇
Moving Averages Simplified\U0001f4d2
— Stock Market Scientist\u2122 (@MarketScientist) April 30, 2020
\U0001f535Its a technical indicator used by traders to identify trading opportunities
\U0001f535Its a Lagging indicator
\U0001f5352 MAs which traders use more often are..
SMA(Simple moving average) & EMA(Exponential moving average)
1/n#StockMarket #Technicals pic.twitter.com/ClDPEgVWZP
Here is the single point to access
all the threads of Price Patterns📈
1️⃣H&S Pattern
https://t.co/fmWhajgRFk
2️⃣C&H Pattern
https://t.co/6ZW977dCbr
3️⃣Flag Patterns
https://t.co/YUVRiLrVgI
4️⃣Wedge Patterns
https://t.co/6Lhka9dgyw
Happy Learning..!! 😇
H & S Pattern Simplified\U0001f4d2
— Stock Market Scientist\u2122 (@MarketScientist) May 25, 2020
Head & Shoulder Pattern\U0001f4ca
\U0001f535It is\xa0formed by a peak (shoulder), followed by a higher peak (head), & then another lower peak (shoulder)
\U0001f535A line called neckline\xa0is\xa0drawn by connecting the lowest points of the two troughs
1/n#StockMarket #Technicals pic.twitter.com/ElCKkli5h3
Here are the links of some important threads of bearish reversal candlestick patterns for new TA learners📒
1️⃣Bearish Engulfing
https://t.co/OKlGOb8zts
2️⃣Evening Star
https://t.co/ZR13zhZUt8
3️⃣3 Black Crows
https://t.co/NQunzmm31E
Happy Learning..!😇
Bearish Engulfing Simplified\U0001f4d2
— Stock Market Scientist\u2122 (@MarketScientist) June 6, 2020
\U0001f535It consists of a small \xa0(green)candle\xa0followed by a large down (red)candle that engulf the smaller candle
\U0001f535It generally appears near the end of an uptrend or in the pullbacks of a larger downtrend
\U0001f535It is one of the reliable reversal pattern pic.twitter.com/9EQqdcvsSa
Here are the links to access all the threads of Price Patterns📈
1️⃣H&S Pattern
https://t.co/fmWhajgRFk
2️⃣C&H Pattern
https://t.co/6ZW977dCbr
3️⃣Flag Patterns
https://t.co/YUVRiLrVgI
4️⃣Wedge Patterns
https://t.co/6Lhka9dgyw
Happy Learning..!! 😇
H & S Pattern Simplified\U0001f4d2
— Stock Market Scientist\u2122 (@MarketScientist) May 25, 2020
Head & Shoulder Pattern\U0001f4ca
\U0001f535It is\xa0formed by a peak (shoulder), followed by a higher peak (head), & then another lower peak (shoulder)
\U0001f535A line called neckline\xa0is\xa0drawn by connecting the lowest points of the two troughs
1/n#StockMarket #Technicals pic.twitter.com/ElCKkli5h3
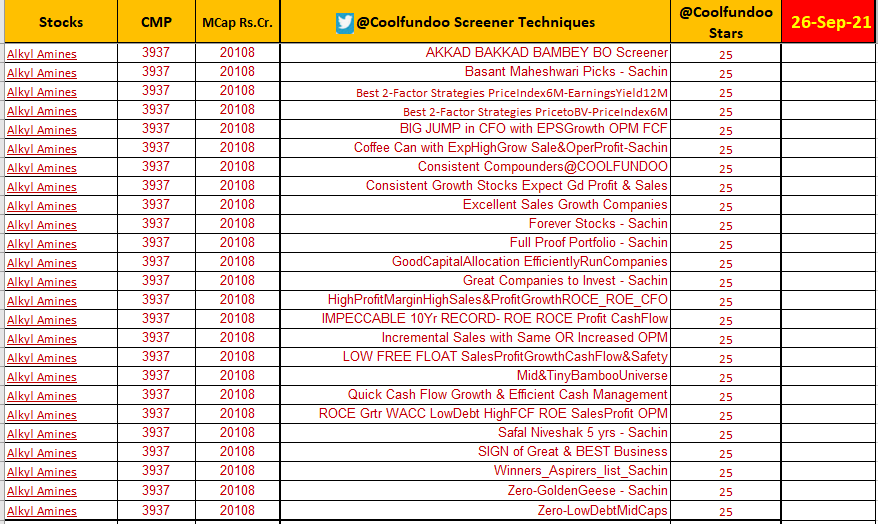
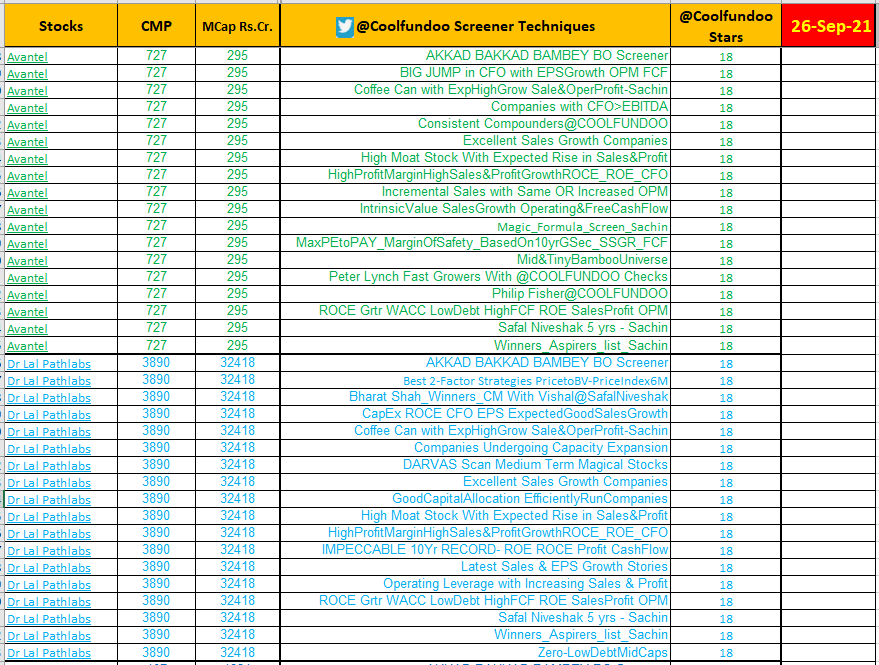
More from Screeners

1) Volatility, Volume & daily range compression scanner
2) Punch-Drunk-Love
3) GE Ratio - to track fundamentally strong stocks
4) Recently created one to track Power Play setups.
I get around 150-200 stocks daily & choose the ones with the most potential.
Sir, How do u find a set up - Do you track chart of each stock daily ? Or do u have filters , that lead you to a number of stocks , after which you scan them.
— AKASH GUPTA (@lockdownmurti) August 25, 2021


Russell 2000
It is better if you spend considerable time learning these concepts. https://t.co/caBHOO4Owa
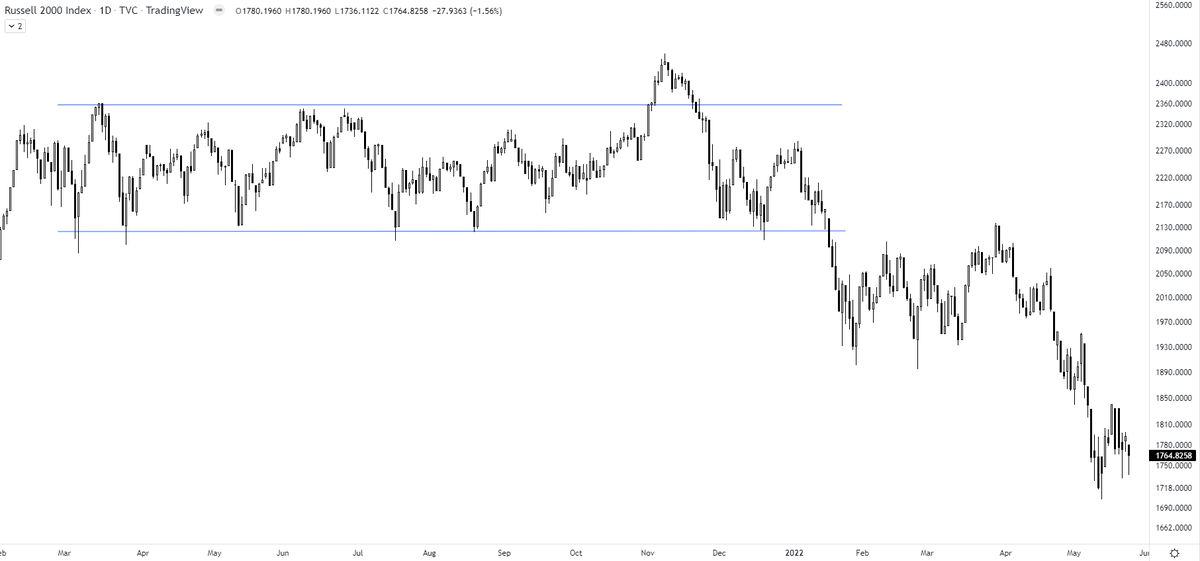
TRAPS? In a false breakout, the price breaks out of the range & comes back within the range. A trap is one step ahead, price not only comes back within the range but breaks down in the opposite direction. It traps the initial longs who didn't close their positions
— The_Chartist \U0001f4c8 (@charts_zone) January 22, 2022
Russell 2000 pic.twitter.com/txzjdnStzc

You May Also Like


Covering one of the most unique set ups: Extended moves & Reversal plays
Time for a 🧵 to learn the above from @iManasArora
What qualifies for an extended move?
30-40% move in just 5-6 days is one example of extended move
How Manas used this info to book
The stock exploded & went up as much as 63% from my price.
— Manas Arora (@iManasArora) June 22, 2020
Closed my position entirely today!#BroTip pic.twitter.com/CRbQh3kvMM
Post that the plight of the
What an extended (away from averages) move looks like!!
— Manas Arora (@iManasArora) June 24, 2020
If you don't learn to sell into strength, be ready to give away the majority of your gains.#GLENMARK pic.twitter.com/5DsRTUaGO2
Example 2: Booking profits when the stock is extended from 10WMA
10WMA =
#HIKAL
— Manas Arora (@iManasArora) July 2, 2021
Closed remaining at 560
Reason: It is 40+% from 10wma. Super extended
Total revenue: 11R * 0.25 (size) = 2.75% on portfolio
Trade closed pic.twitter.com/YDDvhz8swT
Another hack to identify extended move in a stock:
Too many green days!
Read
When you see 15 green weeks in a row, that's the end of the move. *Extended*
— Manas Arora (@iManasArora) August 26, 2019
Simple price action analysis.#Seamecltd https://t.co/gR9xzgeb9K