ULTIMATE GUIDE TO 21 and 200 Moving Average
— JayneshKasliwal (@JayneshKasliwal) November 14, 2021
SUNDAY THREAD \U0001f516
A trend Following System That will Help You Improve Trading immensely.
RETWEET AND SHARE \U0001f504@kuttrapali26 @AmitabhJha3 #stocks #StockMarket
1/n
The Ultimate Guide to moving averages !
A mega thread to understand the Use of 21 , 50 and 200 ema.
4 Effective uses of Exponential Moving Averages !
Retweet and Share 🔄
#stockmarkets #nifty
@kuttrapali26 @caniravkaria
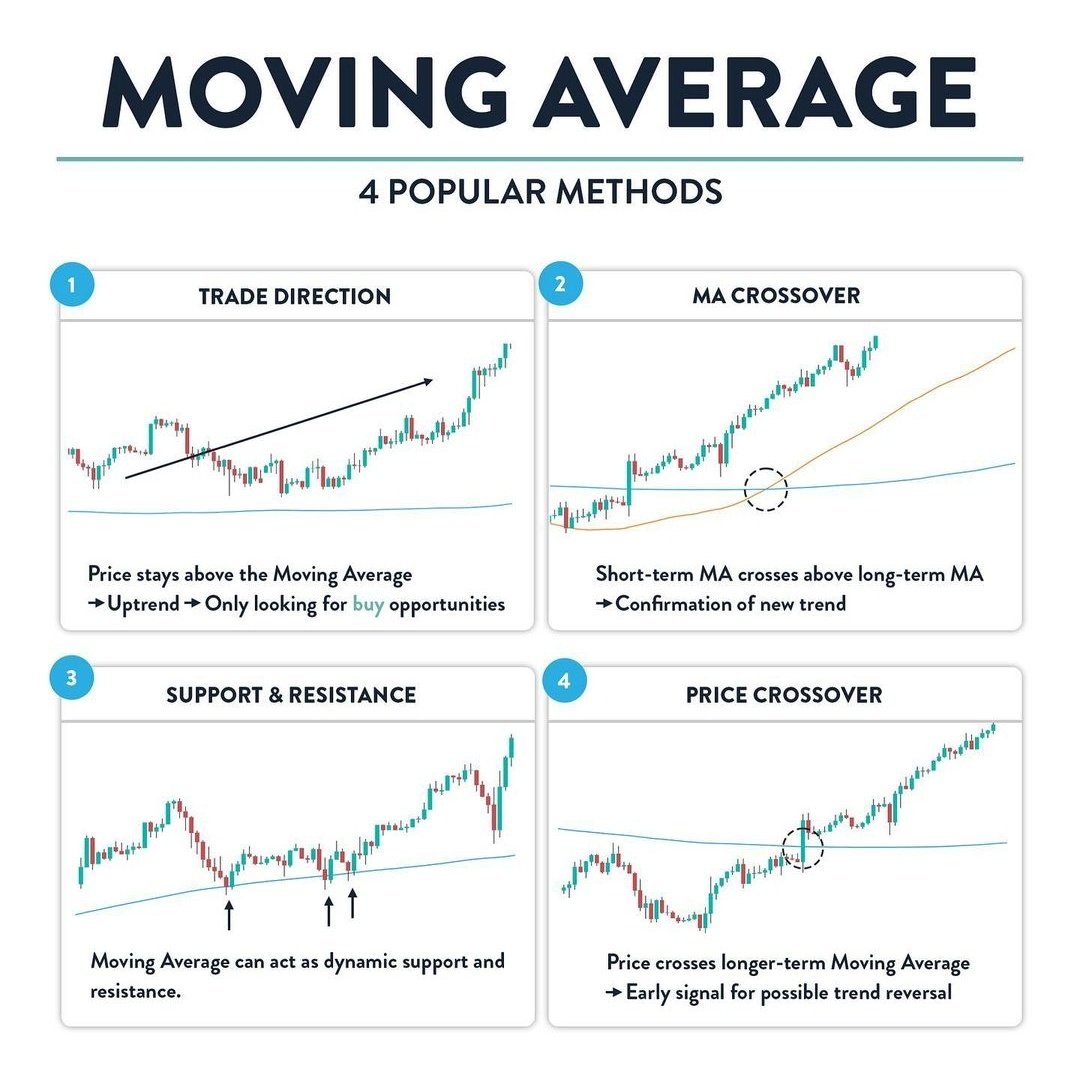
1. Identifying the direction of trend
2. MA crossover
3. Dynamic Support and Resistance
4. Price Crossing above Key EMAs
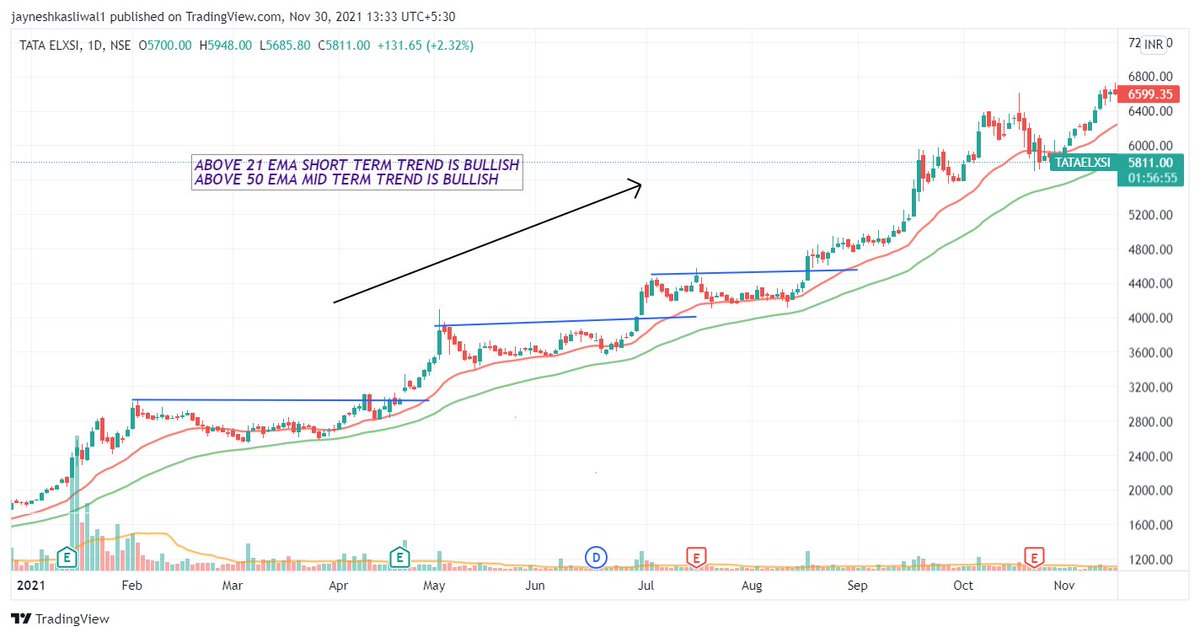
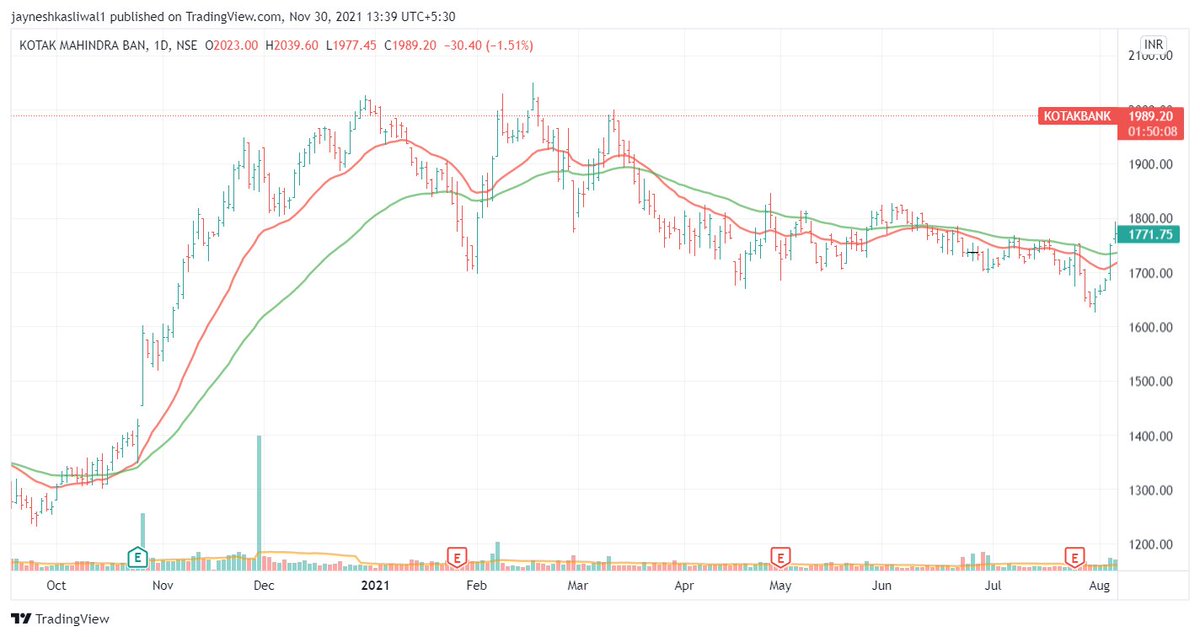
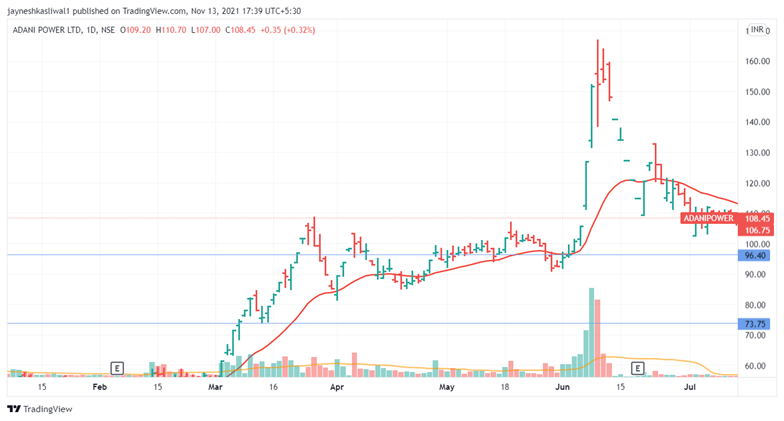
Note : In chart 21 ema is red , 50 ema is green and 200 ema is black
2/n
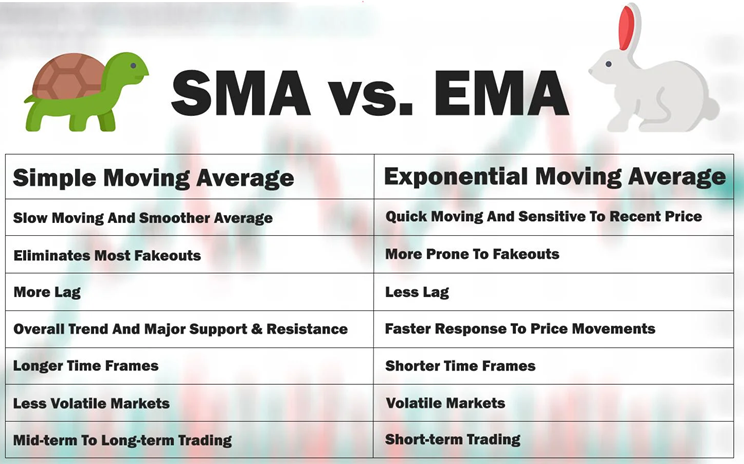
The 21 ema will tell us the Short term trend of a stock , while the 200 ema will tell us the long term trend of a stocks
Any EMA that is sloping
:upwards trend is BULLISH
:sideways trend is NEUTRAL
:downwards trend is BEARISH
4/n
When Moving averages turn flat means the stock is in consolidation and is in sideways zone .
Generally this occurs after an uptrend or downtrend and may lead to continuation of previous trend .
This is generally no trading zone for swing traders
5/n
2. Whenever ema is sloping downwards its called dowtrend
3. Whenever ema is sideways its called consolidation
⏫Buy in uptrend
⏬Sell in downtrend
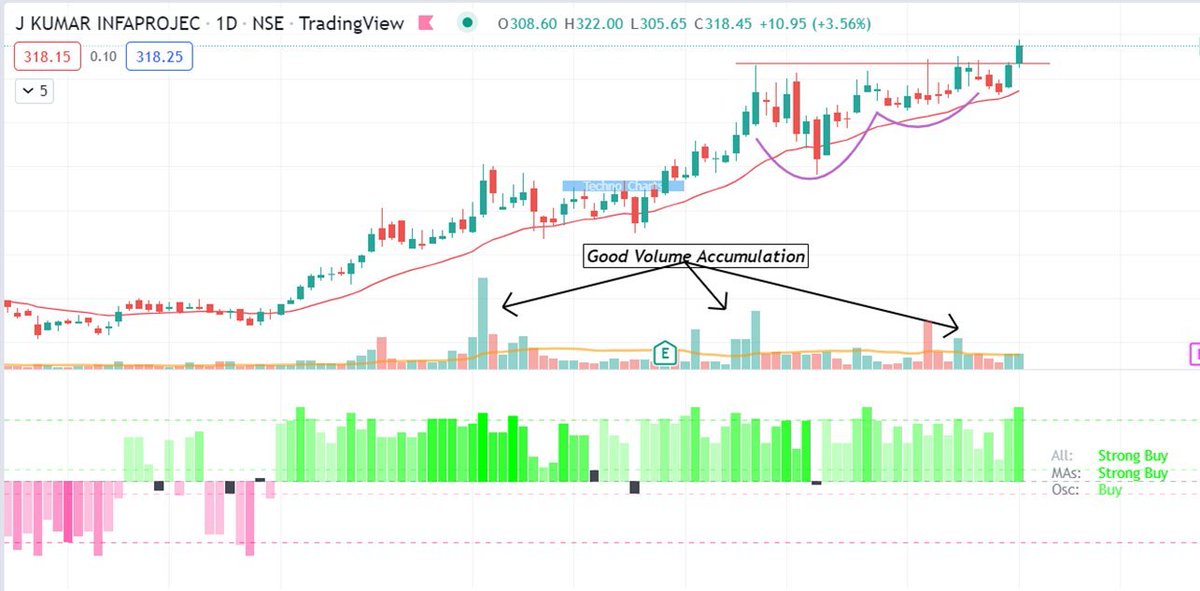
Whenever stocks move too away from ema it is extended and pullsback
6/n
1. Whenever the 21 ema crosses 50 ema from down to up short term trend changes from bearish to bullish and vice versa.
2. The 21 Should be above 50 ema for uptrend and below 50 ema for downtrend
Ex:
7/n
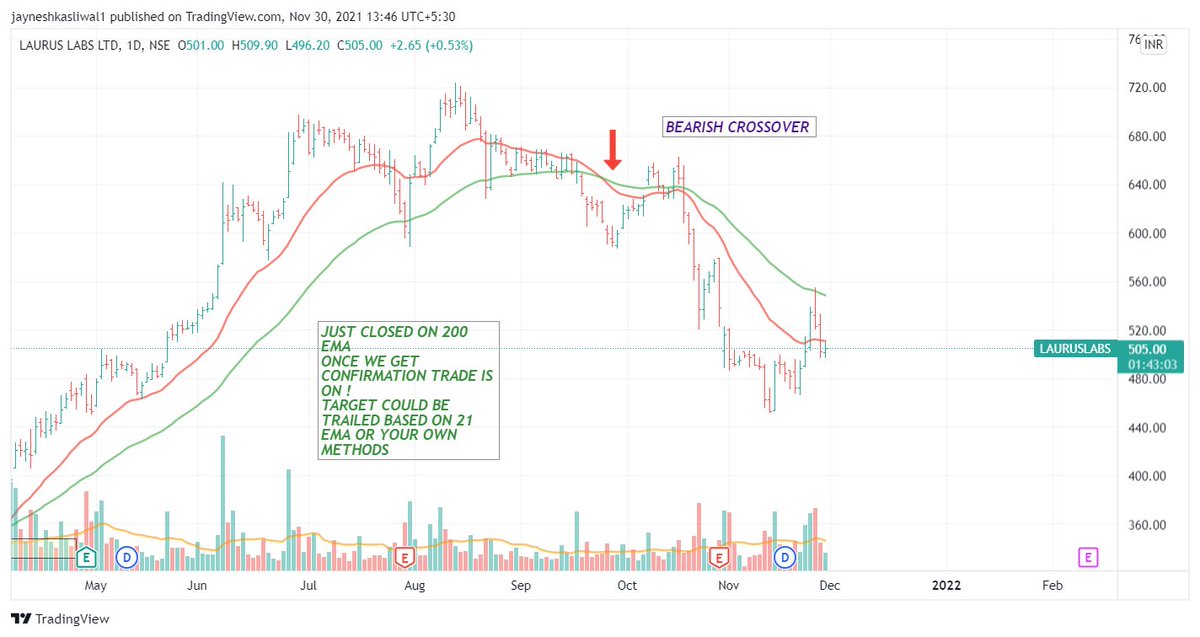
Crossover shouldnt be traded solely as it can lead to multiple signals of buy and sell ,always use confirmation of volume , price etc to take trade .
During consolidation you will get many signals and hence its not advised to use during sideways trend
8/n
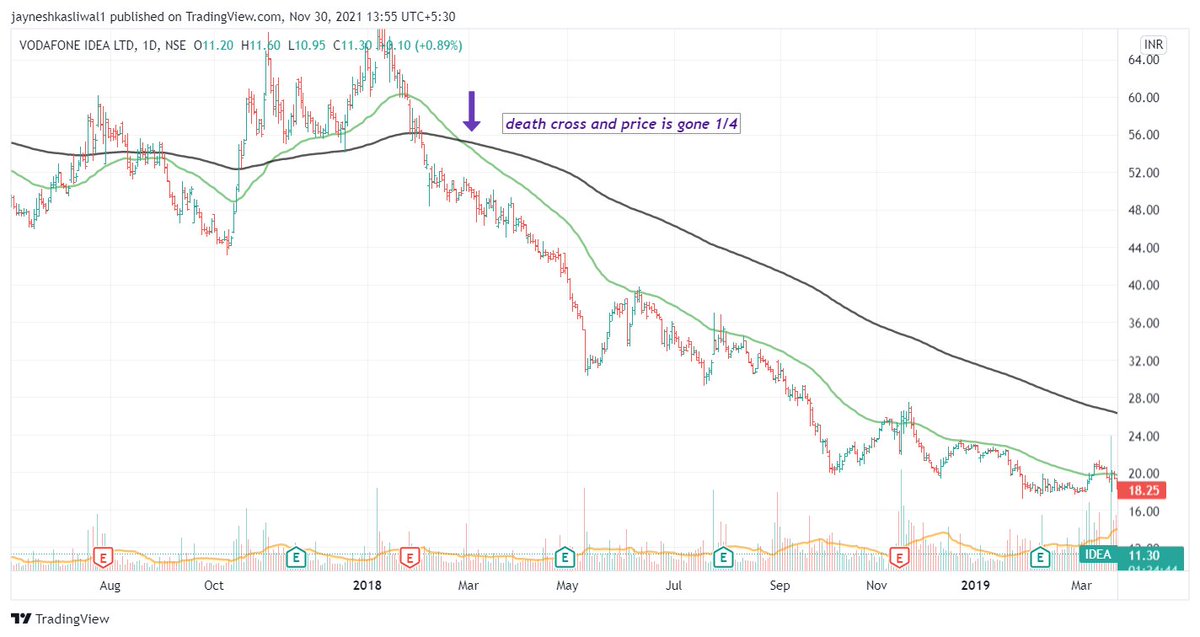
50 cutting 200 from down : Golden Cross
50 cuttinf 200 from up : Death Cross
The Long term trend changes when DEATH CROSS happens and its one of the most dangerous situations
Price falls raidly after the Death Cross
9/n
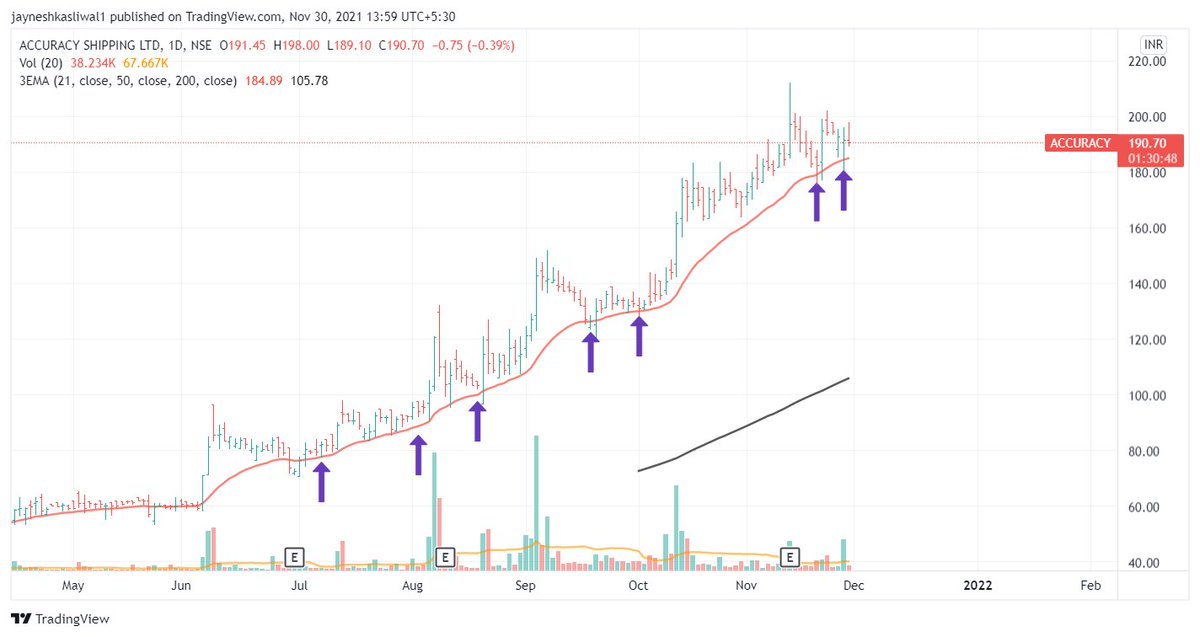
1. 21 ema Dynamic support for trending stocks in short term
2. 50 ema dynamic support for mid term
3. 200 ema dynamic support for long term
Examples Explained !
10/n
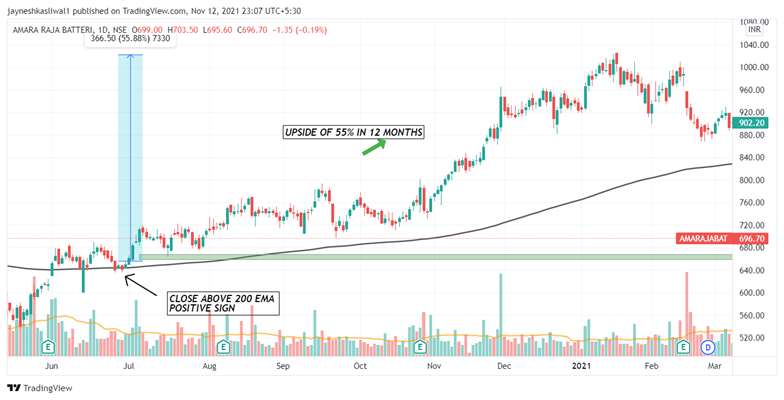
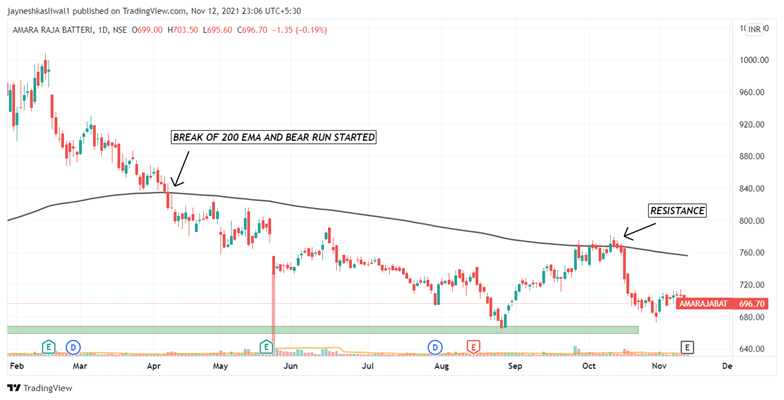
200 EMA : THE LONG TERM TREND
1. When a stock price crosses its 200-day moving average, it is a technical signal that a reversal has occurred.
11/n
4. One may consider investing in stocks if the stock is below 200 ema only if he is confirmed about the fundamentals of the stock
5. Some may not agree with this and its ok!
12/n
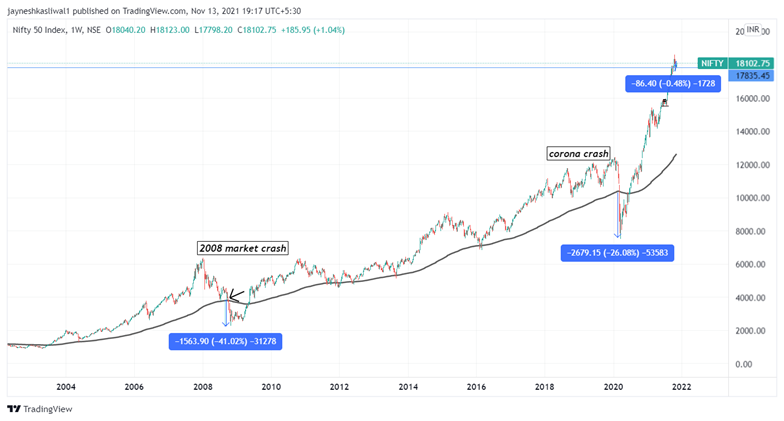
1. If you use 200 ema on weekly timeframe you can be in a trend for a very long time
2.The sell signs will be given late as we are using weekly timeframe
@rohanshah619 @Puretechnicals9
13/n
https://t.co/T09LUm1HsI
My telegram Free Group
https://t.co/b4N4oPAto9
More from JayneshKasliwal
A thread of threads on 3 indicators
1. Moving Averages Ultimate Guide
2. All About ADX
3. Super Performance Using RELATIVE STRENGTH
Retweet and Share
Moving Average
All about
Super Performance Using RELATIVE STRENGTH
1. Moving Averages Ultimate Guide
2. All About ADX
3. Super Performance Using RELATIVE STRENGTH
Retweet and Share
Moving Average
The Ultimate Guide to moving averages !
— JayneshKasliwal (@JayneshKasliwal) November 30, 2021
A mega thread to understand the Use of 21 , 50 and 200 ema.
4 Effective uses of Exponential Moving Averages !
Retweet and Share \U0001f504#stockmarkets #nifty @kuttrapali26 @caniravkaria
All about
A Thread on indicator : ADX
— JayneshKasliwal (@JayneshKasliwal) January 1, 2022
Average Directional Index a Quick Guide
Retweet Share !@Techno_Charts
1/n pic.twitter.com/wRvQo5JNKN
Super Performance Using RELATIVE STRENGTH
A Mega Thread on RELATIVE STRENGTH
— JayneshKasliwal (@JayneshKasliwal) January 10, 2022
A method to improve
Stock Selection and Conviction in trades
Retweet \U0001f504And Follow @JayneshKasliwal
𝟱 𝗧𝗿𝗮𝗱𝗶𝗻𝗴𝘃𝗶𝗲𝘄 𝗜𝗻𝗱𝗶𝗰𝗮𝘁𝗼𝗿𝘀 𝗮𝗹𝗹 𝗧𝗿𝗮𝗱𝗲𝗿𝘀 𝘀𝗵𝗼𝘂𝗹𝗱 𝗸𝗻𝗼𝘄 𝗮𝗯𝗼𝘂𝘁:
𝗣𝗮𝗿𝘁 𝟮
🧵 Thread 🧵
Retweet And I will Link a 36 Page PDF
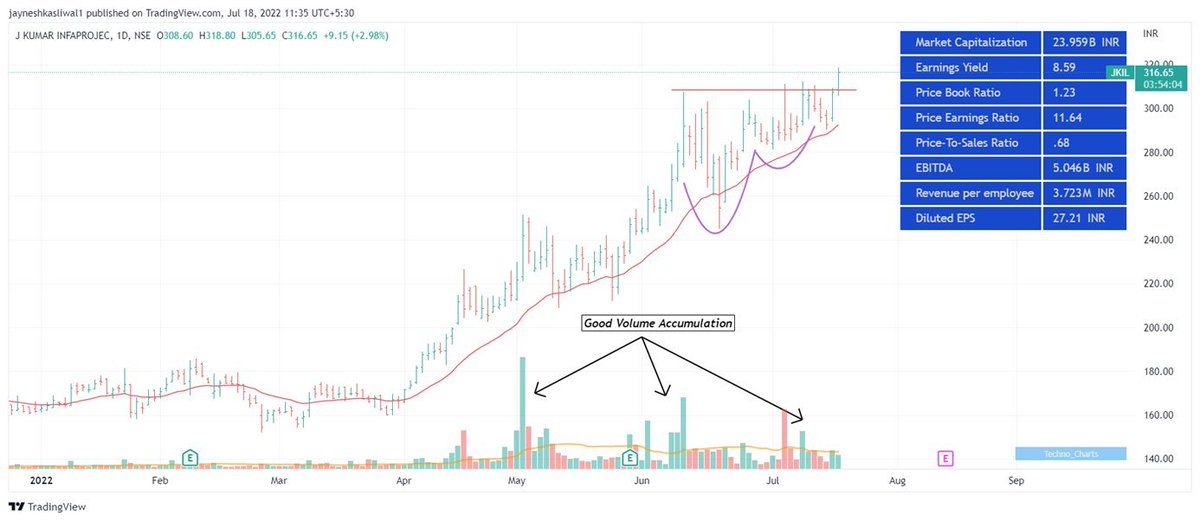
𝟭. 𝗔𝗱𝗱 𝗙𝘂𝗻𝗱𝗮𝗺𝗲𝗻𝘁𝗮𝗹𝘀 𝗼𝗻 𝗰𝗵𝗮𝗿𝘁
🔸 Link:
https://t.co/zG165Xa3JB
🔸 Click on the above link -> Add to Favourites -> Add on Chart from favourites and start using it !
2/20
You can add financials from many fundamental criteria's like
🔸 Cashflows
🔸 Income Statements
🔸 Balance sheets
🔸 PE,PB ratios
🔸 Marketcapitlization
🔸 Statistics
3/20
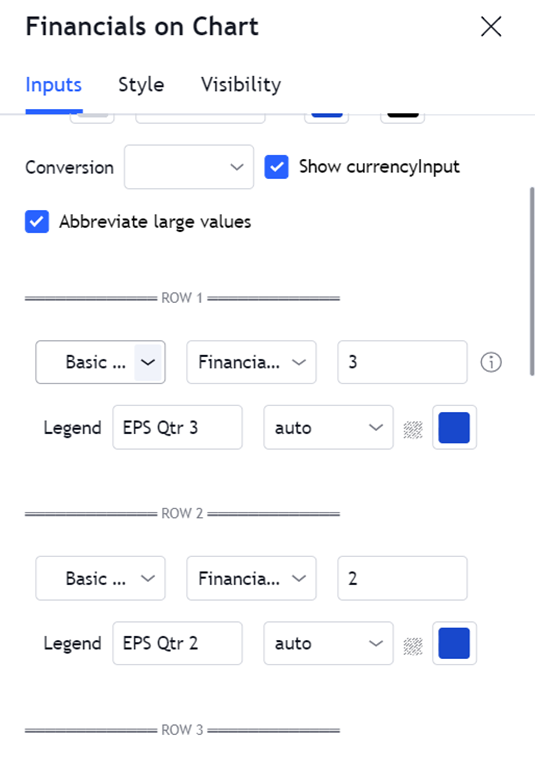
How to change Settings:
🔸 There are 8 columns you can basically select any financial you want
🔸 You can select quarterly or Yearly values and can also write
🔸 The names of the financiaLS Example : EPS Qtr3
🔸 You can Change colours , font size
4/20
𝟮. 𝗜𝗻𝗱𝗶𝗰𝗮𝘁𝗼𝗿 𝗥𝗮𝘁𝗶𝗻𝗴𝘀
You cannot track each and every indicator like ( 𝗠𝗼𝘃𝗶𝗻𝗴 𝗔𝘃𝗴𝘀 , 𝗥𝗦𝗜 , 𝗠𝗔𝗖𝗗 ) etc , you can use plot this custom strategy to understand whether the trend is positive or negative of those indicators
5/20
𝗣𝗮𝗿𝘁 𝟮
🧵 Thread 🧵
Retweet And I will Link a 36 Page PDF
𝟭. 𝗔𝗱𝗱 𝗙𝘂𝗻𝗱𝗮𝗺𝗲𝗻𝘁𝗮𝗹𝘀 𝗼𝗻 𝗰𝗵𝗮𝗿𝘁
🔸 Link:
https://t.co/zG165Xa3JB
🔸 Click on the above link -> Add to Favourites -> Add on Chart from favourites and start using it !
2/20
You can add financials from many fundamental criteria's like
🔸 Cashflows
🔸 Income Statements
🔸 Balance sheets
🔸 PE,PB ratios
🔸 Marketcapitlization
🔸 Statistics
3/20
How to change Settings:
🔸 There are 8 columns you can basically select any financial you want
🔸 You can select quarterly or Yearly values and can also write
🔸 The names of the financiaLS Example : EPS Qtr3
🔸 You can Change colours , font size
4/20
𝟮. 𝗜𝗻𝗱𝗶𝗰𝗮𝘁𝗼𝗿 𝗥𝗮𝘁𝗶𝗻𝗴𝘀
You cannot track each and every indicator like ( 𝗠𝗼𝘃𝗶𝗻𝗴 𝗔𝘃𝗴𝘀 , 𝗥𝗦𝗜 , 𝗠𝗔𝗖𝗗 ) etc , you can use plot this custom strategy to understand whether the trend is positive or negative of those indicators
5/20


𝗛𝗼𝘄 𝘁𝗼 𝗰𝗿𝗲𝗮𝘁𝗲 𝘆𝗼𝘂𝗿 𝗼𝘄𝗻 𝗖𝗵𝗮𝗿𝘁𝗶𝗻𝗸 𝗦𝗰𝗿𝗲𝗲𝗻𝗲𝗿
🧵 Thread 🧵
[1/15]
𝗖𝗵𝗮𝗿𝘁𝗶𝗻𝗸 𝗦𝗰𝗿𝗲𝗲𝗻𝗲𝗿 is a Stock screening tool that is useful to screen stocks based on Technical & Fundamentals.
🔸 It scans stocks by using technical indicators like RSI, MACD, divergences, etc.
🔸 It also uses fundamental tools like Book Value, EPS,PE etc
[2/15]
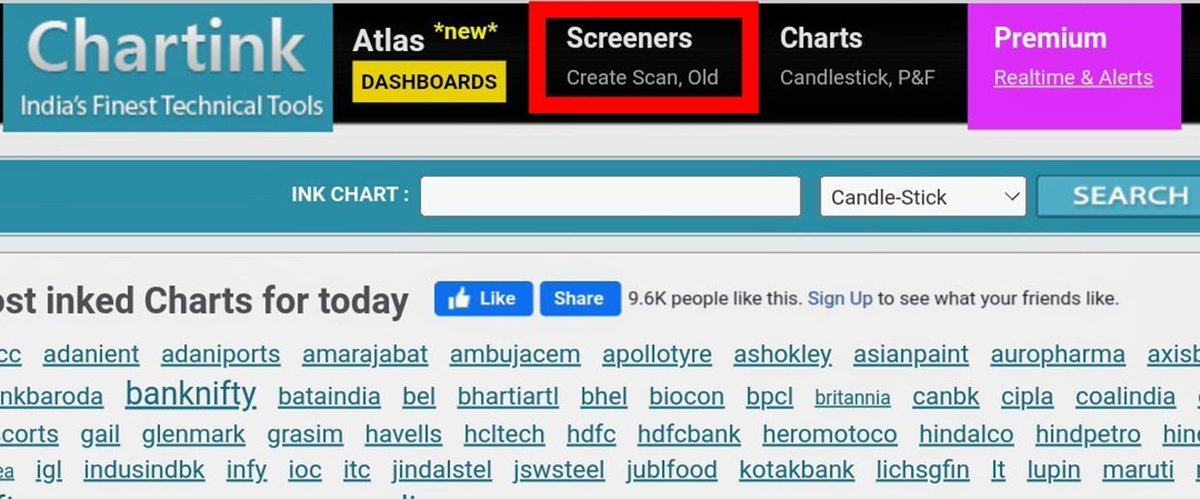
How To Create A Scan ?
Go to https://t.co/nQ7t44bt9T & click on 𝘊𝘳𝘦𝘢𝘵𝘦 𝘚𝘤𝘢𝘯 under 𝘚𝘤𝘳𝘦𝘦𝘯𝘦𝘳𝘴.
[3/15]
𝗙𝗶𝗿𝘀𝘁 𝗦𝘁𝗲𝗽 𝗧𝗼 𝗙𝗶𝗹𝘁𝗲𝗿 𝗦𝘁𝗼𝗰𝗸𝘀
We can select segments of stocks of our choice, e.g. cash or futures stocks, Nifty 100 etc.
Click on green ‘+’ icon to add conditions.
[4/15]

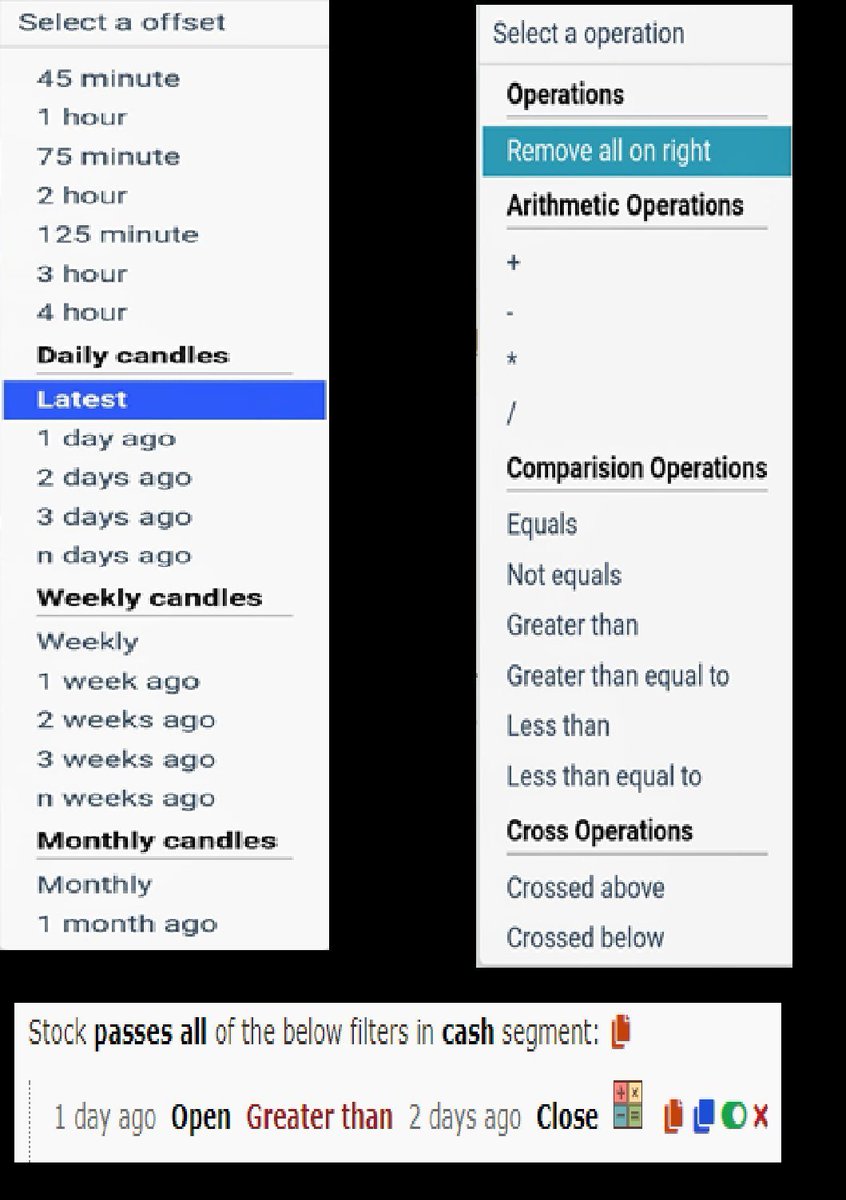
𝗖𝗮𝗻𝗱𝗹𝗲 𝗧𝗶𝗺𝗲𝗳𝗿𝗮𝗺𝗲𝘀 & 𝗖𝗼𝗺𝗽𝗮𝗿𝗶𝘀𝗼𝗻 𝗢𝗽𝗲𝗿𝗮𝘁𝗼𝗿𝘀
🔸 We can select any timeframe of candles in Chartink, from minutes to years.
🔸 And compare two candles using comparison operators like 𝘌𝘲𝘶𝘢𝘭 𝘵𝘰 or 𝘎𝘳𝘦𝘢𝘵𝘦𝘳 𝘛𝘩𝘢𝘯 , crossovers etc
[5/15]
🧵 Thread 🧵
[1/15]
𝗖𝗵𝗮𝗿𝘁𝗶𝗻𝗸 𝗦𝗰𝗿𝗲𝗲𝗻𝗲𝗿 is a Stock screening tool that is useful to screen stocks based on Technical & Fundamentals.
🔸 It scans stocks by using technical indicators like RSI, MACD, divergences, etc.
🔸 It also uses fundamental tools like Book Value, EPS,PE etc
[2/15]
How To Create A Scan ?
Go to https://t.co/nQ7t44bt9T & click on 𝘊𝘳𝘦𝘢𝘵𝘦 𝘚𝘤𝘢𝘯 under 𝘚𝘤𝘳𝘦𝘦𝘯𝘦𝘳𝘴.
[3/15]
𝗙𝗶𝗿𝘀𝘁 𝗦𝘁𝗲𝗽 𝗧𝗼 𝗙𝗶𝗹𝘁𝗲𝗿 𝗦𝘁𝗼𝗰𝗸𝘀
We can select segments of stocks of our choice, e.g. cash or futures stocks, Nifty 100 etc.
Click on green ‘+’ icon to add conditions.
[4/15]
𝗖𝗮𝗻𝗱𝗹𝗲 𝗧𝗶𝗺𝗲𝗳𝗿𝗮𝗺𝗲𝘀 & 𝗖𝗼𝗺𝗽𝗮𝗿𝗶𝘀𝗼𝗻 𝗢𝗽𝗲𝗿𝗮𝘁𝗼𝗿𝘀
🔸 We can select any timeframe of candles in Chartink, from minutes to years.
🔸 And compare two candles using comparison operators like 𝘌𝘲𝘶𝘢𝘭 𝘵𝘰 or 𝘎𝘳𝘦𝘢𝘵𝘦𝘳 𝘛𝘩𝘢𝘯 , crossovers etc
[5/15]
I have designed many beginner to advanced
Option Strategies free of cost
Here is a thread of all 🧵
A Retweet would help :)
Begin Your Algo Trading Journey
https://t.co/xIA6SIgGRj
1/n

Banknifty Option Selling Strategy :
https://t.co/r6vxQY212o
2/n

Banknifty option Buying :
https://t.co/w3QukixFD2
3/n
Advanced Intraday Strangle :
https://t.co/v1KynrLb03
4/n

Option Strategies free of cost
Here is a thread of all 🧵
A Retweet would help :)
Begin Your Algo Trading Journey
https://t.co/xIA6SIgGRj
1/n
Banknifty Option Selling Strategy :
https://t.co/r6vxQY212o
2/n
Banknifty option Buying :
https://t.co/w3QukixFD2
3/n
Advanced Intraday Strangle :
https://t.co/v1KynrLb03
4/n
You May Also Like


#24hrstartup recap and analysis
What a weekend celebrating makers looks like.
A thread
👇Read on
Let's start with a crazy view of what @ProductHunt looked like on Sunday
Download image and upload
A top 7 with:
https://t.co/6gBjO6jXtB @Booligoosh
https://t.co/fwfKbQha57 @stephsmithio
https://t.co/LsSRNV9Jrf @anthilemoon
https://t.co/Fts7T8Un5M @J_Tabansi
Spotify Ctrl @shahroozme
https://t.co/37EoJAXEeG @kossnocorp
https://t.co/fMawYGlnro
If you want some top picks, see @deadcoder0904's thread,
We were going to have a go at doing this, but he nailed it.
It also comes with voting links 🖐so go do your
Over the following days the 24hr startup crew had more than their fair share of launches
Lots of variety: web, bots, extensions and even native apps
eg. @jordibruin with
What a weekend celebrating makers looks like.
A thread
👇Read on
Let's start with a crazy view of what @ProductHunt looked like on Sunday
Download image and upload
A top 7 with:
https://t.co/6gBjO6jXtB @Booligoosh
https://t.co/fwfKbQha57 @stephsmithio
https://t.co/LsSRNV9Jrf @anthilemoon
https://t.co/Fts7T8Un5M @J_Tabansi
Spotify Ctrl @shahroozme
https://t.co/37EoJAXEeG @kossnocorp
https://t.co/fMawYGlnro
If you want some top picks, see @deadcoder0904's thread,
We were going to have a go at doing this, but he nailed it.
It also comes with voting links 🖐so go do your
#24hrsstartup was an amazing event
— Akshay Kadam(A2K) \U0001f47b (@deadcoder0904) November 19, 2018
I never went to a hackathon but this just felt like one even though I was just watching \U0001f440
Everyone did great but there were a few startups that I personally loved \U0001f496
Some of my favorites are in the thread below\U0001f447
Over the following days the 24hr startup crew had more than their fair share of launches
Lots of variety: web, bots, extensions and even native apps
eg. @jordibruin with
\U0001f3a8\U0001f3c3\u200d\u2640\ufe0f DrawRun just launched on Product Hunt! Idea to App Store to Product Hunt in 68 hours!\u2070\u2070https://t.co/mxnLZ8FRSu
— Jordi Bruin (@jordibruin) November 20, 2018
Thanks for the motivation @thepatwalls @arminulrich @_feloidea

MDZS is laden with buddhist references. As a South Asian person, and history buff, it is so interesting to see how Buddhism, which originated from India, migrated, flourished & changed in the context of China. Here's some research (🙏🏼 @starkjeon for CN insight + citations)
1. LWJ’s sword Bichen ‘is likely an abbreviation for the term 躲避红尘 (duǒ bì hóng chén), which can be translated as such: 躲避: shunning or hiding away from 红尘 (worldly affairs; which is a buddhist teaching.) (https://t.co/zF65W3roJe) (abbrev. TWX)
2. Sandu (三 毒), Jiang Cheng’s sword, refers to the three poisons (triviṣa) in Buddhism; desire (kāma-taṇhā), delusion (bhava-taṇhā) and hatred (vibhava-taṇhā).
These 3 poisons represent the roots of craving (tanha) and are the cause of Dukkha (suffering, pain) and thus result in rebirth.
Interesting that MXTX used this name for one of the characters who suffers, arguably, the worst of these three emotions.
3. The Qian kun purse “乾坤袋 (qián kūn dài) – can be called “Heaven and Earth” Pouch. In Buddhism, Maitreya (मैत्रेय) owns this to store items. It was believed that there was a mythical space inside the bag that could absorb the world.” (TWX)