1) Get a cup of coffee.
In this thread, I'm going to walk you through "The Kelly Criterion".
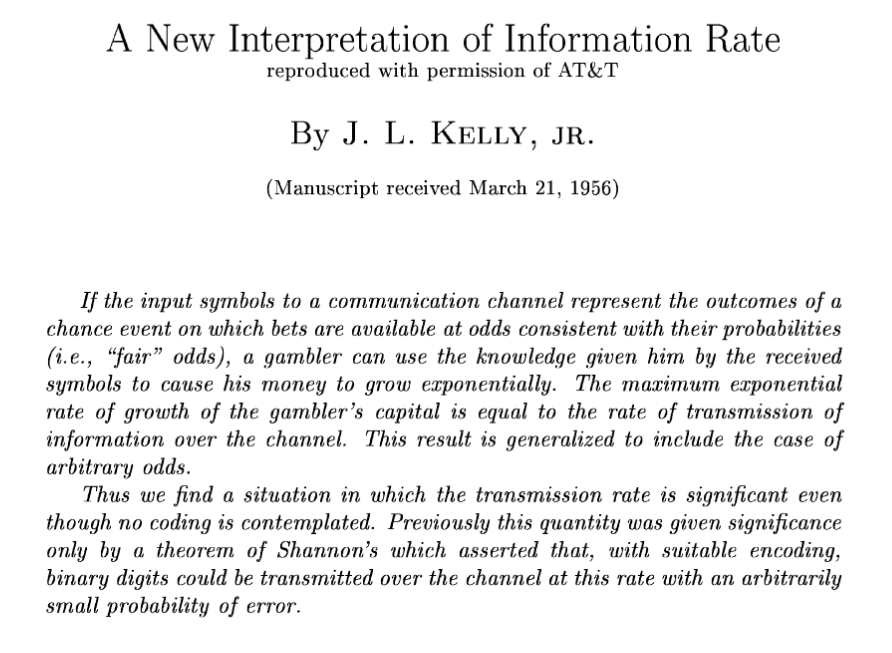
This is what is now known as the Kelly Criterion.
I'll keep it as realistic as possible:
Imagine that you walk into an antique store one day. Due to the persistence of the salesman there, you buy an old lamp from him.

He also enrolls you in Robinhood's fractional share trading program, but not in margin or options trading.
ALAD is a very special stock. Each month, the stock either exactly doubles or exactly halves in value. There's a 50/50 chance of either outcome, and no way to predict it in advance.
At the end of 20 years, all the stock in your account will be liquidated, the account will be closed, and its entire value will be given to you in cash.
The only thing within your control is the portfolio rebalancing at the start of each month.
So what should your rebalancing strategy be?

During this month, ALAD can either double or halve.
So, for every $1 you invest in ALAD at the beginning of the month, you'll have either $2 or $0.50 at the end.
On average, you'll have ($2 + $0.50)/2 = $1.25.
This is beginning to look like a no-brainer.
Clearly, the best way to proceed is to go "All In". Put your entire initial $1 in ALAD, and hold it for 20 yrs.
Best case: ALAD doubles every single month. That leaves you with many, many billions of dollars.
Worst case: ALAD gets halved every single month. That leaves you with an insignificant fraction of a penny.
These are like tossing a coin 240 times (once a month for 20 years) and expecting to get heads (or tails) every single time.
So what does the *average* case look like?
Remember that on average, you make 25% per month? Compounded over 20 years, that turns your $1 into many billions.
So, in all likelihood, you'll make out like a bandit, right?
Not so fast.
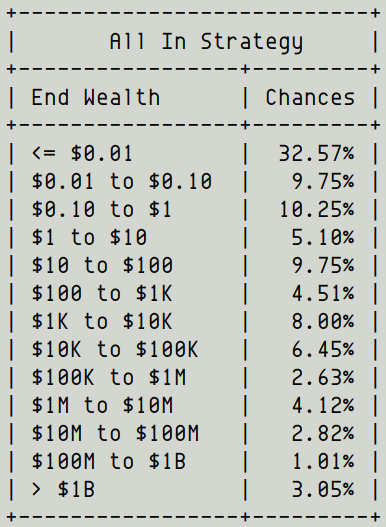
And a 67.4% chance that you'll end up with less than $100.
And only a 3% chance that you'll end up a billionaire.
It's because outliers skew the average.
The billion dollar plus outcomes are so good that they lift up the entire average.
Kind of like one winning lottery ticket compensating for thousands of duds.
These doublings and halvings cancel each other, leaving you with roughly the same $1 you started with.
*Most likely* outcomes are not swayed by outliers. *Averages* are.
In this case, you will *most likely* end up with just $1. But *on average*, you expect to end up with billions.
You need a strategy that maybe gives up some of the unlikely billions in potential upside, but buys you a very good chance of turning that $1 into $100K or $1M.
That's the genius of Kelly. He found that strategy.
At the start of each month, rebalance your portfolio so that exactly half of it is in cash and the other half is in ALAD stock.
The difference is night and day.
Just take a look at this table:
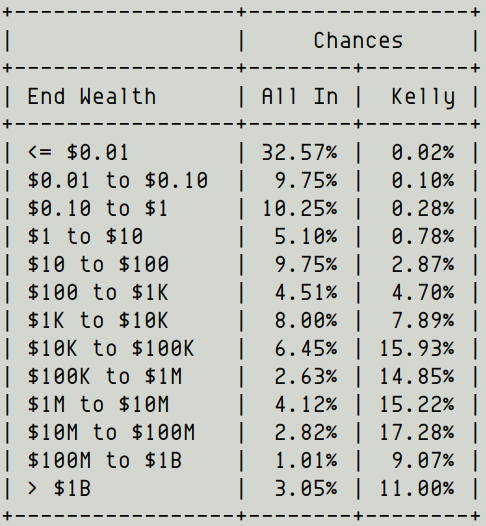
Kelly also gives you a 50+% chance of ending up a millionaire, and a 11% chance of ending up a billionaire!
The *average* outcome is still in the many billions, although Kelly does sacrifice some of the tail-end mega-billions.
When you apply the math to this particular problem, it so happens that you get 1/2 and 1/2 as the optimal strategy.
What if ALAD could quadruple, double, stay the same, or halve?
What if there was more than 1 stock: Aladdin Enterprises and Jasmine Enterprises?
Kelly's theory is applicable to all this and more.
"Fortune's Formula" by @WPoundstone is an excellent non-technical book that covers the Kelly Criterion in some detail.
https://t.co/soE2dFHDTH
https://t.co/76dL3uu0Ot
https://t.co/dagvcvorZo
https://t.co/QAypqSA5N5
https://t.co/tplsgSr2mG
1/7 Thread: Ergodicity
— Mostly Borrowed Ideas (@borrowed_ideas) May 17, 2020
Let\u2019s play a game.
Assume you have $100. We\u2019ll flip a coin 100 times. Your wealth will be +50% for each Heads, and -40% for Tails.
Wanna play?
Of course, you should! The expected value for each flip is $5.
But should you really? Let\u2019s figure out.
https://t.co/FQDocNUnL4
Turns out there’s actually some interest in the core mathematical theory behind the Kelly Criterion.
So, with a shout out to @borrowed_ideas who encouraged me to include this, here’s an appendix to the tweetstorm that gets into the math.
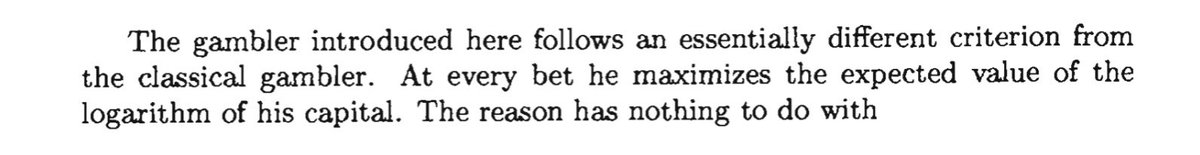
Instead of maximizing the wealth you expect to have at the end of each round, maximize the logarithm of this wealth.
At the start of a particular month, suppose our portfolio is worth $X. We divide this into two fractions: $f*X and $(1-f)*X.
We put $f*X in ALAD and keep $(1-f)*X in cash.
If we’re lucky, the ALAD part of our portfolio would have doubled. So the whole portfolio will be worth $f*X*2 + $(1-f)*X.
But if we’re unlucky, the ALAD part would have halved, leaving us with $f*X/2 + $(1-f)*X.
Lucky case: log(X*(1+f))
Unlucky case: log(X*(1-f/2))
0.5*log(X*(1+f)) + 0.5*log(X*(1-f/2)),
which simplifies to:
log(X) + 0.5*log(1 + f/2 - f^2/2).
That’s the same as maximizing 1 + f/2 - f^2/2, which happens to be:
9/2 - 2*(f - 1/2)^2.
Maximizing this means minimizing (f - 1/2)^2.
And that means choosing f = 1/2.
So choosing f=1/2 means we put half the portfolio in ALAD stock.
The other half, (1-f), goes to cash.
And that’s how you do the math behind the Kelly Criterion.
More from 10-K Diver
1/
Get a cup of coffee.
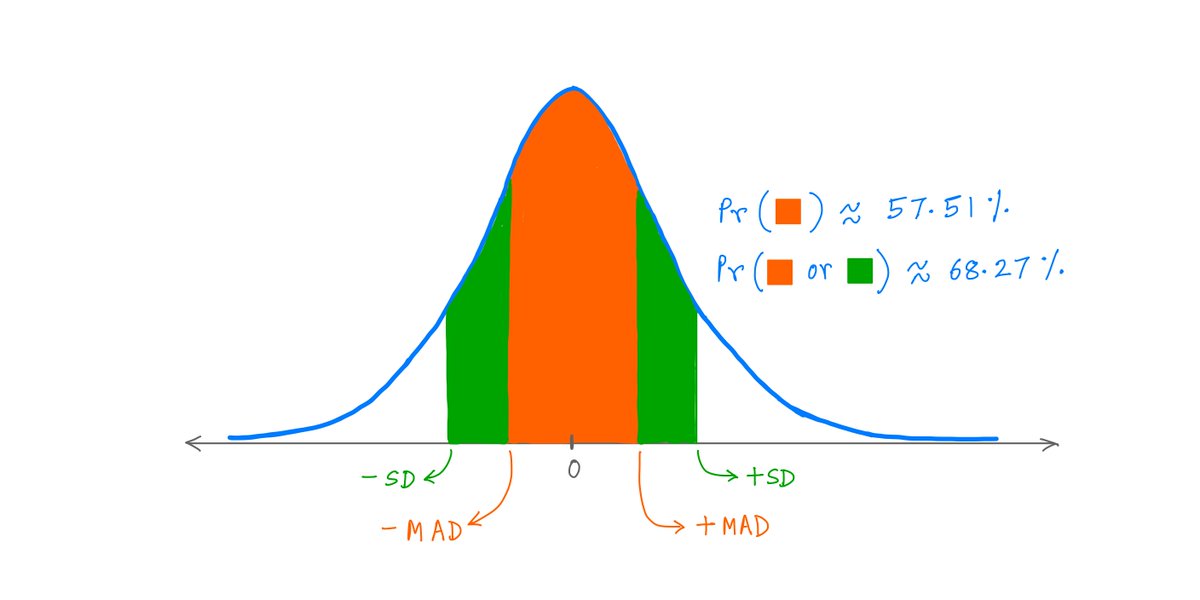
In this thread, I'll walk you through 2 probability concepts: Standard Deviation (SD) and Mean Absolute Deviation (MAD).
This will give you insight into Fat Tails -- which are super useful in investing and in many other fields.
2/
Recently, I watched 2 probability "mini-lectures" on YouTube by Nassim Taleb.
One ~10 min lecture covered SD and MAD. The other ~6 min lecture covered Fat Tails.
In these ~16 mins, @nntaleb shared so many useful nuggets that I had to write this thread to unpack them.
3/
For those curious, here are the YouTube links to the lectures:
SD and MAD (~10 min): https://t.co/0TwubymdE6
Fat Tails (~6 min):
4/
The first thing to understand is the concept of a Random Variable.
In essence, a Random Variable is a number that depends on a random event.
For example, when we roll a die, we get a Random Variable -- a number from the set {1, 2, 3, 4, 5, 6}.
5/
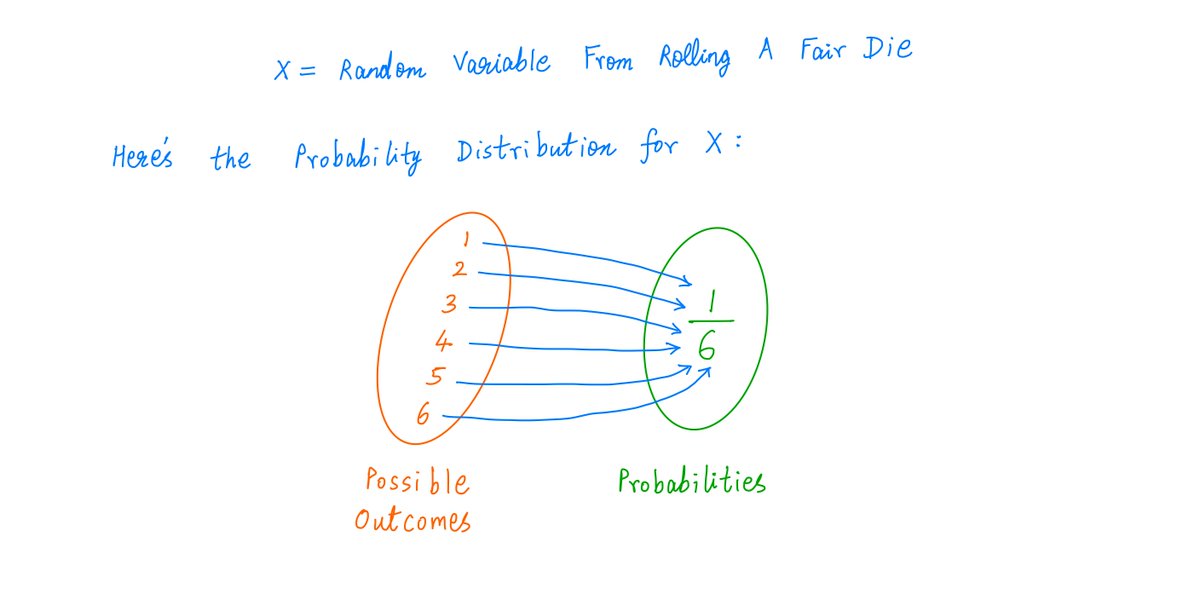
Every Random Variable has a Probability Distribution.
This tells us all the possible values the Random Variable can take, and their respective probabilities.
For example, when we roll a fair die, we get a Random Variable with this Probability Distribution:
Get a cup of coffee.
In this thread, I'll walk you through 2 probability concepts: Standard Deviation (SD) and Mean Absolute Deviation (MAD).
This will give you insight into Fat Tails -- which are super useful in investing and in many other fields.
2/
Recently, I watched 2 probability "mini-lectures" on YouTube by Nassim Taleb.
One ~10 min lecture covered SD and MAD. The other ~6 min lecture covered Fat Tails.
In these ~16 mins, @nntaleb shared so many useful nuggets that I had to write this thread to unpack them.
3/
For those curious, here are the YouTube links to the lectures:
SD and MAD (~10 min): https://t.co/0TwubymdE6
Fat Tails (~6 min):
4/
The first thing to understand is the concept of a Random Variable.
In essence, a Random Variable is a number that depends on a random event.
For example, when we roll a die, we get a Random Variable -- a number from the set {1, 2, 3, 4, 5, 6}.
5/
Every Random Variable has a Probability Distribution.
This tells us all the possible values the Random Variable can take, and their respective probabilities.
For example, when we roll a fair die, we get a Random Variable with this Probability Distribution: