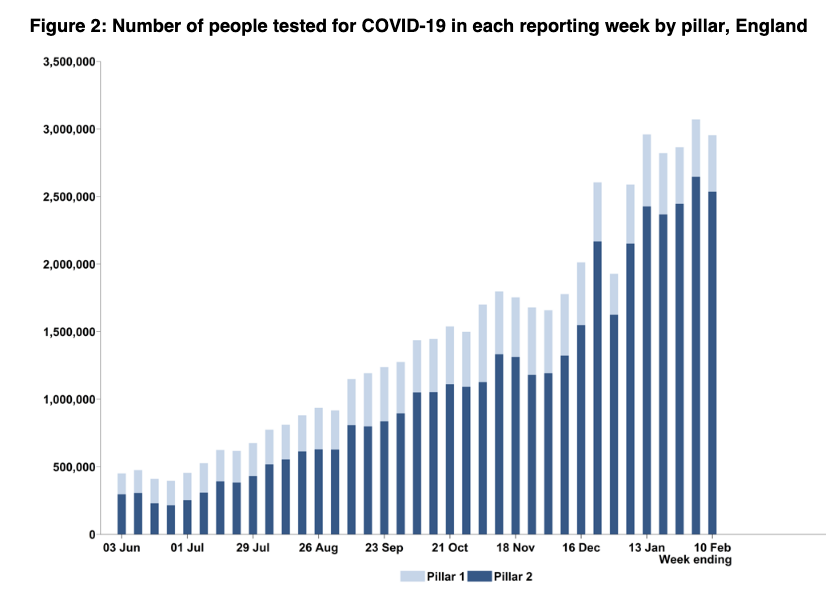
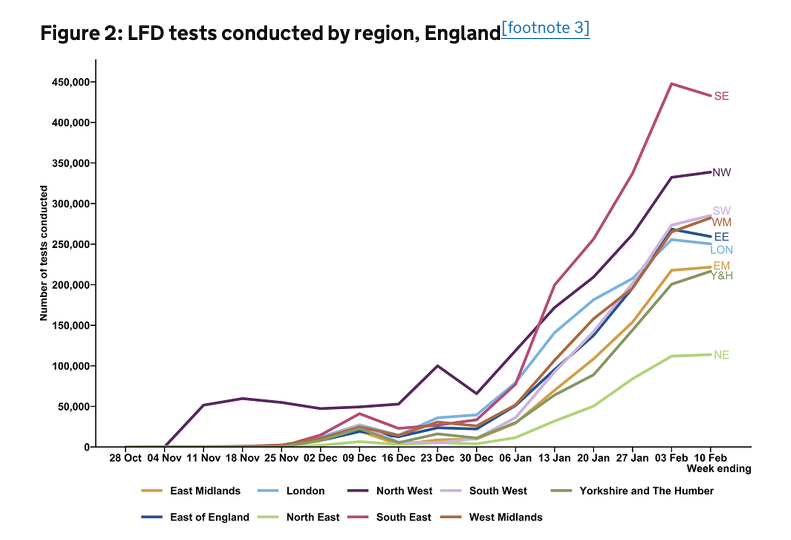
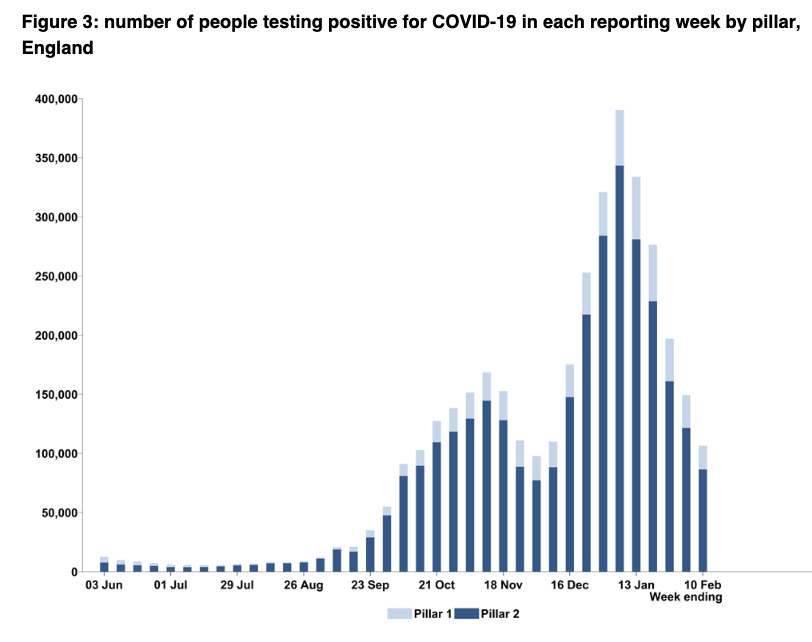
Most recent T&T data now out, covers 4th - 10th Feb
LFD use continues to rise but more slowly than last week and T&T performance remains consistent.
And as ever we don't know about who isn't tested and who struggles to isolate.
🧵
https://t.co/lffa72M9YJ

By contrast, PCR test use for people with symptoms fallen week on week for the past month (PHE positivity data due later).

Need to mitigate any unintended harm, esp around jobs
That's 106k cases.
Both these percentages are similar to previous weeks.
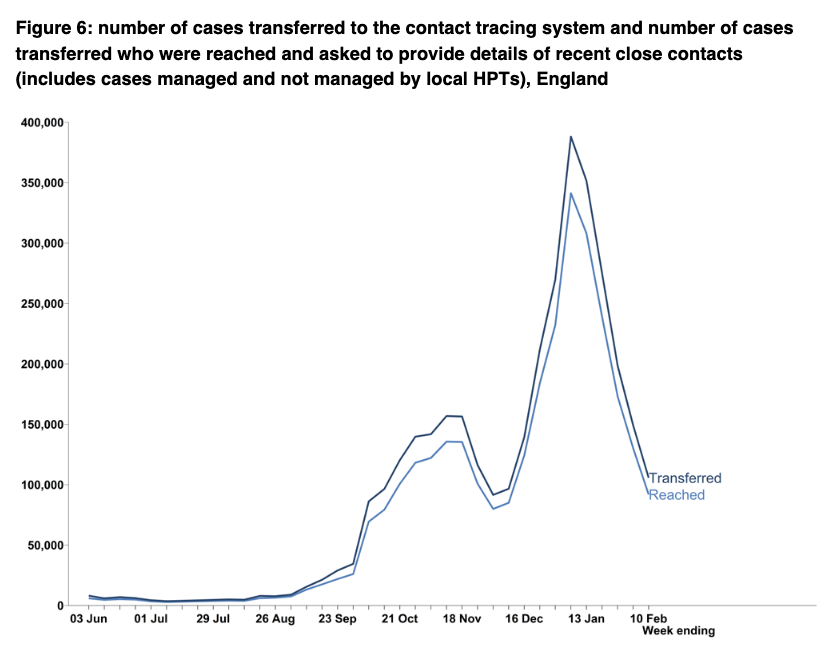
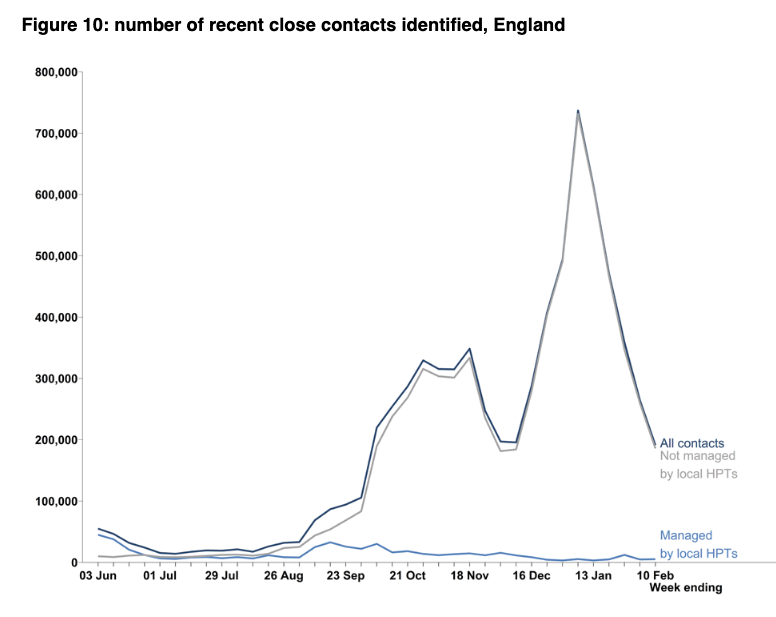
Worth noting that given lockdown, 87% of identified contacts were household contacts of which 97% were reached, this compares with 71% of non-household contacts.
These percentages reached have all been similar since start of Dec.
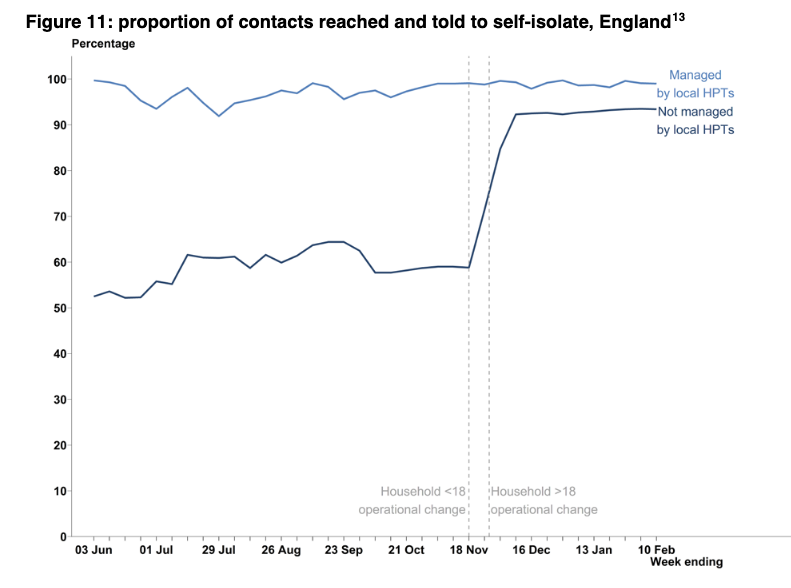
Local teams generally pick up cases that can't be reached by the national team within 24hrs and their role may become ever more important as case numbers fall.
Room for improvement but definitely not getting worse.
Everyone needs to be confident they will have the support needed if testing positive, and that their job – however insecure – will not be put at risk.
@Jeanelleuk @fascinatorfun @profchrisham @petermbenglish
@HPIAndyCowper @Davewwest @HSJEditor @KateAlvanley
@IndependentSage @nedwards_1 @chrischirp @SamanthaJonesUK
And pls say if you'd rather not be tagged in these threads each week.
More from Government

The Government is making the same mistakes as it did in the first wave. Except with knowledge.
A thread.
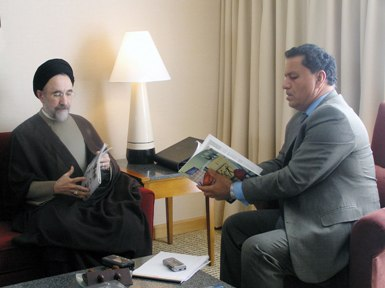
The Government's strategy at the beginning of the pandemic was to 'cocoon' the vulnerable (e.g. those in care homes). This was a 'herd immunity' strategy. This interview is from
This strategy failed. It is impossible to 'cocoon' the vulnerable, as Covid is passed from younger people to older, more vulnerable people.
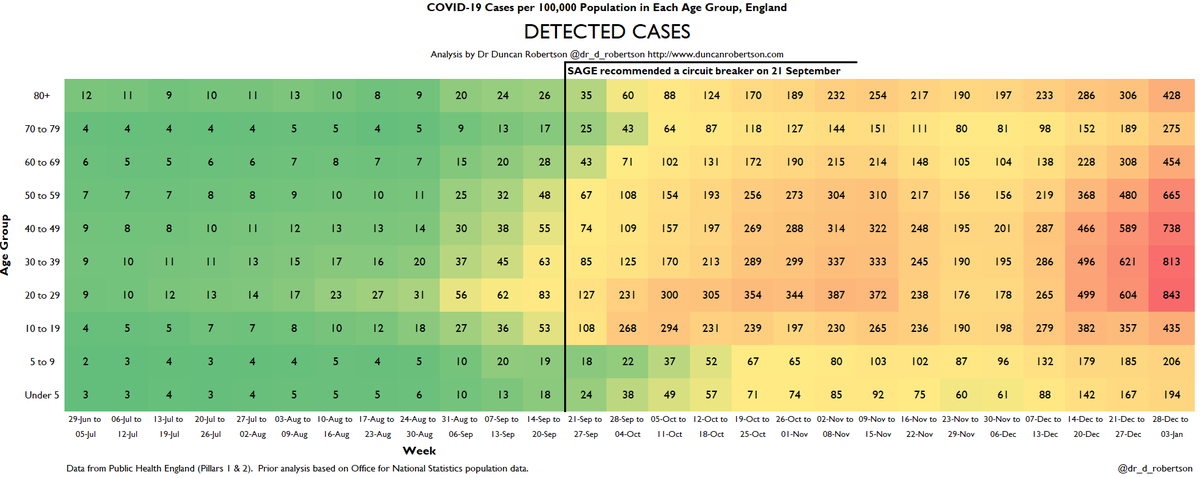
We can see this playing out through heatmaps. e.g. these heatmaps from the second
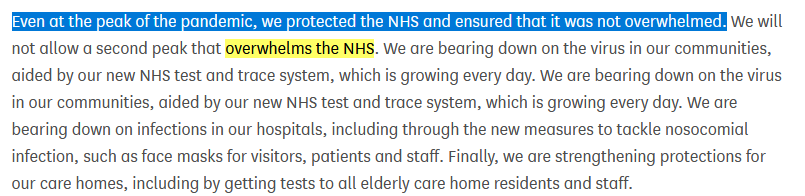
The Government then decided to change its strategy to 'preventing a second wave that overwhelms the NHS'. This was announced on 8 June in Parliament.
This is not the same as 'preventing a second wave'.
https://t.co/DPWiJbCKRm
The Academy of Medical Scientists published a report on 14 July 'Preparing for a Challenging Winter' commissioned by the Chief Scientific Adviser that set out what needed to be done in order to prevent a catastrophe over the winter
A thread.
The Government's strategy at the beginning of the pandemic was to 'cocoon' the vulnerable (e.g. those in care homes). This was a 'herd immunity' strategy. This interview is from
Government #coronavirus science advisor Dr David Halpern tells me of plans to \u2018cocoon\u2019 vulnerable groups. pic.twitter.com/dhECJNbmnI
— Mark Easton (@BBCMarkEaston) March 11, 2020
This strategy failed. It is impossible to 'cocoon' the vulnerable, as Covid is passed from younger people to older, more vulnerable people.
We can see this playing out through heatmaps. e.g. these heatmaps from the second
Here are the heatmaps for Covid detected cases, positivity, hospitalizations, and ICU admissions. This is for the week to 3 January 2021.
— Dr Duncan Robertson (@Dr_D_Robertson) January 7, 2021
I have marked a line on 21 September, when SAGE recommended a circuit breaker, so you can see how the situation has deteriorated since then. pic.twitter.com/SEEVgUVK4j
The Government then decided to change its strategy to 'preventing a second wave that overwhelms the NHS'. This was announced on 8 June in Parliament.
This is not the same as 'preventing a second wave'.
https://t.co/DPWiJbCKRm
The Academy of Medical Scientists published a report on 14 July 'Preparing for a Challenging Winter' commissioned by the Chief Scientific Adviser that set out what needed to be done in order to prevent a catastrophe over the winter
One thing civil servants learn is to write things down. Here is @acadmedsci's 14 July report commissioned by @uksciencechief. For the record.
— Dr Duncan Robertson (@Dr_D_Robertson) September 17, 2020


Abbott is pushing a lie to protect incompetence. There is no Federal oversight of the Texas Grid, ergo fewer regulations (sound familiar) - so point one: state legislature needs reform. 2/
2. Point 2: there were clear signs the grid would get overloaded under extreme cold conditions. Why? Due to a vacuum of regulations mandating winterization of turbines and power generators. This from sources, in Texas!
3. Point 3: Of the power shortfall that hit Texas, over 80% was due to problems at coal and gas fired plants. Power generators were just not winterized. Decisions to do so have been ignored since the 1990s.
4. Point 4: these are winterized wind turbines in Denmark. The ocean is frozen. The turbines are generating.
5. #Texas| the main issue is: catastrophic governance at the State level (no Federal oversight of the Texas grid) failing to allocate funding to winterise the Natural Gas, Coal and Wind Turbine elements that contribute to the grid. (~ 80/20
Texas Gov. Abbott blames solar and wind for the blackouts in his state and says "this shows how the Green New Deal would be a deadly deal for the United States of America" pic.twitter.com/YfVwa3YRZQ
— Andrew Lawrence (@ndrew_lawrence) February 17, 2021
2. Point 2: there were clear signs the grid would get overloaded under extreme cold conditions. Why? Due to a vacuum of regulations mandating winterization of turbines and power generators. This from sources, in Texas!
3. Point 3: Of the power shortfall that hit Texas, over 80% was due to problems at coal and gas fired plants. Power generators were just not winterized. Decisions to do so have been ignored since the 1990s.
4. Point 4: these are winterized wind turbines in Denmark. The ocean is frozen. The turbines are generating.
Same thing in Denmark. It's cold enough here that the ocean is frozen and yet look at those reliable windmills just chugging along. pic.twitter.com/1NTljk7hk9
— Elizabeth Gummere (@BethGummere) February 17, 2021
5. #Texas| the main issue is: catastrophic governance at the State level (no Federal oversight of the Texas grid) failing to allocate funding to winterise the Natural Gas, Coal and Wind Turbine elements that contribute to the grid. (~ 80/20