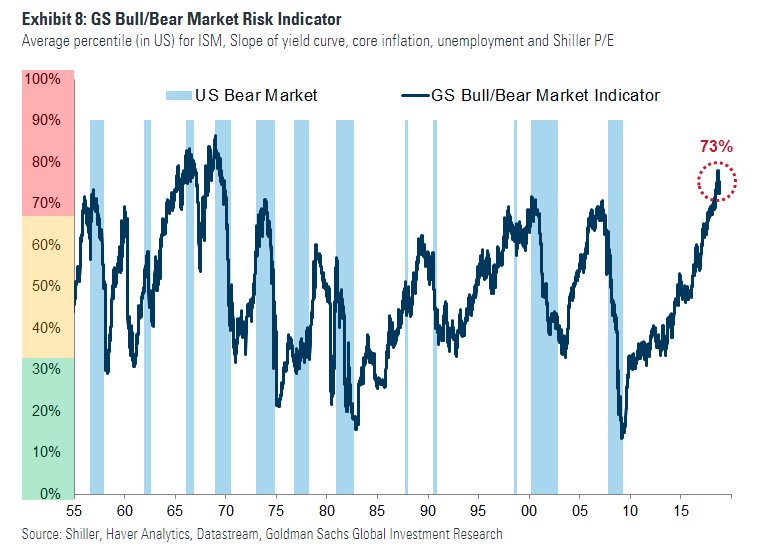
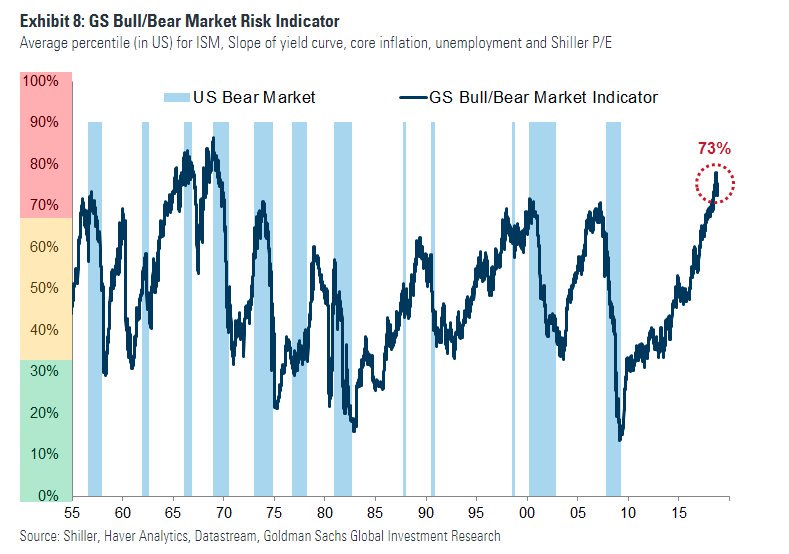
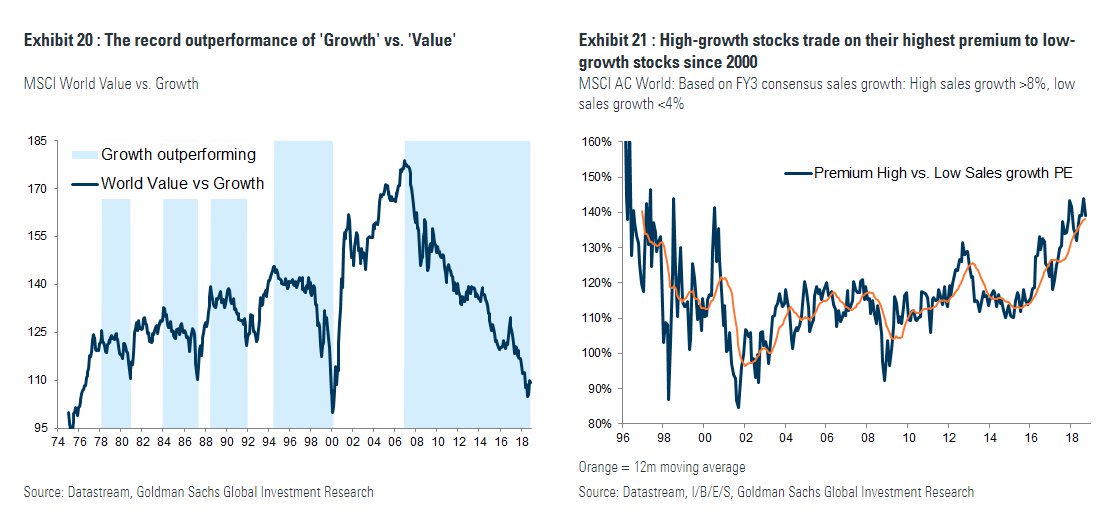
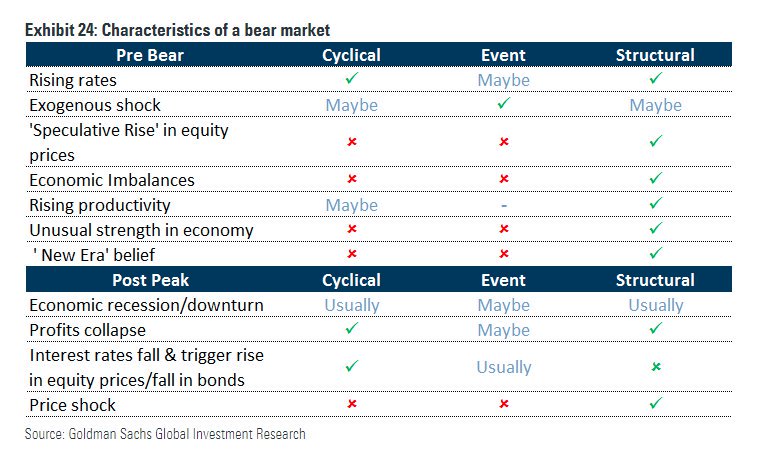
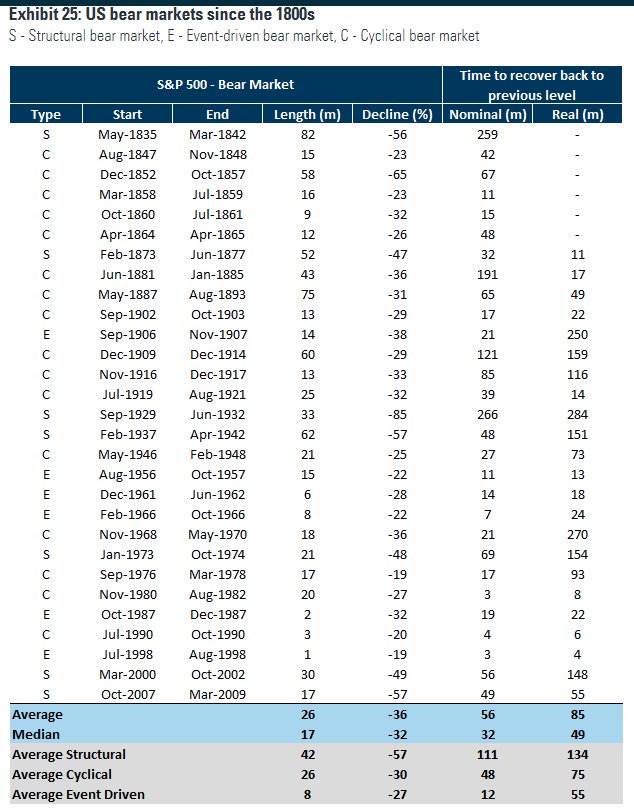
A thread on an interesting report by Goldman Sachs' Peter Oppenheimer, the bank's chief global equity strategist. He points out that Goldman's "Bear Market Risk Indicator" is looking ominous.


More from Economy


Interesting thread, but I don't think ecosocialists or degrowthers are arguing that if German socialists had come to power the world would be green by now. Socialism is not automatically green. Eco-socialism is what it says - a green version of socialism - to be tested /1
The historical counterfactual also in not totally convincing. So let's assume Germany and Europe went socialist. The world economy would have evolved exactly the same way it did? 🤔 I doubt it, this is too deterministic. Examples: /2
We do not know if the transition from coal to oil would have taken place when it took place, the way it did. From Timothy Mitchell we know that oil was a fix for capitalism to bypass the labour strikes of coal workers. One would think that socialists would treat workers better /3
We also do not know if socialist governments would strong arm the Middle East the way capitalists did, starting wars to secure cheap oil, and setting up puppet governments. One would want to think that Rosa Luxembourg would not go down that path..../4
We also do not know if they would have continued colonial unequal exchange, extracting raw materials as cheap as possible from the rest of the world. Without cheap oil and cheap materials, it is anyone's guess if GDP and CO2 would be where it is now. /5
You get the impression from the eco-socialists and degrowthers that humanity wouldn\u2019t face the threat of climate change or biodiversity loss if it weren\u2019t for capitalism (or rather, if it weren\u2019t for capitalist modernity).
— Leigh Phillips (@Leigh_Phillips) February 2, 2021
But I see no evidence to suggest this is the case.
The historical counterfactual also in not totally convincing. So let's assume Germany and Europe went socialist. The world economy would have evolved exactly the same way it did? 🤔 I doubt it, this is too deterministic. Examples: /2
We do not know if the transition from coal to oil would have taken place when it took place, the way it did. From Timothy Mitchell we know that oil was a fix for capitalism to bypass the labour strikes of coal workers. One would think that socialists would treat workers better /3
We also do not know if socialist governments would strong arm the Middle East the way capitalists did, starting wars to secure cheap oil, and setting up puppet governments. One would want to think that Rosa Luxembourg would not go down that path..../4
We also do not know if they would have continued colonial unequal exchange, extracting raw materials as cheap as possible from the rest of the world. Without cheap oil and cheap materials, it is anyone's guess if GDP and CO2 would be where it is now. /5


You May Also Like


@EricTopol @NBA @StephenKissler @yhgrad B.1.1.7 reveals clearly that SARS-CoV-2 is reverting to its original pre-outbreak condition, i.e. adapted to transgenic hACE2 mice (either Baric's BALB/c ones or others used at WIV labs during chimeric bat coronavirus experiments aimed at developing a pan betacoronavirus vaccine)
@NBA @StephenKissler @yhgrad 1. From Day 1, SARS-COV-2 was very well adapted to humans .....and transgenic hACE2 Mice
@NBA @StephenKissler @yhgrad 2. High Probability of serial passaging in Transgenic Mice expressing hACE2 in genesis of SARS-COV-2
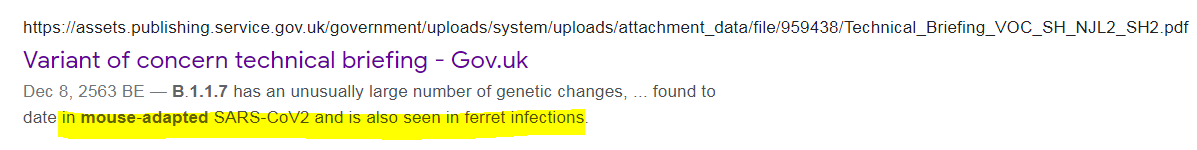
@NBA @StephenKissler @yhgrad B.1.1.7 has an unusually large number of genetic changes, ... found to date in mouse-adapted SARS-CoV2 and is also seen in ferret infections.
https://t.co/9Z4oJmkcKj
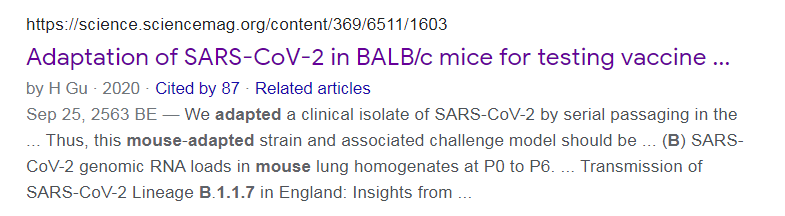
@NBA @StephenKissler @yhgrad We adapted a clinical isolate of SARS-CoV-2 by serial passaging in the ... Thus, this mouse-adapted strain and associated challenge model should be ... (B) SARS-CoV-2 genomic RNA loads in mouse lung homogenates at P0 to P6.
https://t.co/I90OOCJg7o
@NBA @StephenKissler @yhgrad 1. From Day 1, SARS-COV-2 was very well adapted to humans .....and transgenic hACE2 Mice
1. From Day 1, SARS-COV-2 was very well adapted to humans .....and transgenic hACE2 Mice
— Billy Bostickson \U0001f3f4\U0001f441&\U0001f441 \U0001f193 (@BillyBostickson) January 30, 2021
"we generated a mouse model expressing hACE2 by using CRISPR/Cas9 knockin technology. In comparison with wild-type C57BL/6 mice, both young & aged hACE2 mice sustained high viral loads... pic.twitter.com/j94XtSkscj
@NBA @StephenKissler @yhgrad 2. High Probability of serial passaging in Transgenic Mice expressing hACE2 in genesis of SARS-COV-2
1. High Probability of serial passaging in Transgenic Mice expressing hACE2 in genesis of SARS-COV-2!
— Billy Bostickson \U0001f3f4\U0001f441&\U0001f441 \U0001f193 (@BillyBostickson) January 2, 2021
2 papers:
Human\u2013viral molecular mimicryhttps://t.co/irfH0Zgrve
Molecular Mimicryhttps://t.co/yLQoUtfS6s https://t.co/lsCv2iMEQz
@NBA @StephenKissler @yhgrad B.1.1.7 has an unusually large number of genetic changes, ... found to date in mouse-adapted SARS-CoV2 and is also seen in ferret infections.
https://t.co/9Z4oJmkcKj
@NBA @StephenKissler @yhgrad We adapted a clinical isolate of SARS-CoV-2 by serial passaging in the ... Thus, this mouse-adapted strain and associated challenge model should be ... (B) SARS-CoV-2 genomic RNA loads in mouse lung homogenates at P0 to P6.
https://t.co/I90OOCJg7o