Tired of word clouds? Want to do better sentiment analysis? Not sure how to look at the words underneath your measures?

Our long overdue paper on generalized word shift graphs is finally here!
https://t.co/lIBXvbMJWX
https://t.co/vSL1REYT8V

So what are they?

1/n

If we have two texts, there are many ways we can compare them. Weighted averages are a particularly useful measure because they're flexible and interpretable

Proportions, Shannon entropy, the KLD, the JSD, and dictionary methods can all be written as weighted averages

2/n
But weighted avgs are also slippery. When we try to compress complex phenomena like happiness, surprise, divergence, or diversity into a single number, it can be unclear what we're measuring

If the measure goes up, what does that mean? Why did it do that? Can we trust it?

3/n
Very often, that's the end of the line and we're left with an uneasy feeling in the pit of our stomach that our weighted avg is actually picking up a data artifact or some other unintended peculiarity

Word shift graphs help us address those concerns

4/n
First, word shifts look under the hood of weighted averages to see what's going on

All weighted averages are a sum of contributions from individual words. We can pull out those words, and rank which ones contribute the most to the difference between two texts

5/n
But we can go further

Consider dictionary sentiment analysis. We don't just know the scores of words. We also have an understanding of which words are *more* or *less* positive

We know that there's a point on the sentiment scale that distinguishes positive from negative

6/n
The first thing word shifts do is make this *reference value* explicit

For sentiment analysis, this gives us 4 qualitatively different ways a word can contribute:
1. + word is used more
2. - word is used less
3. + word is used less
4. - word is used more

7/n
We can encode the 4 types of word contribution through 4 types of bars

This is how we construct basic word shift graphs. They give us details of both *what* words contribute and *how* they do so

And we've made it easy for you to make your own:
https://t.co/vSL1REYT8V

8/n
But we can go even further! We generalize the word shift framework so that you can use it for more than just single dictionary sentiment analysis

You can word shifts with multiple dictionaries, entropy-based measures, and any metric that can be written as a weighted avg

9/n
Generalized word shifts account for how words can change scores across texts, allowing us to use context-dependent sentiment dictionaries, or measures like entropy

This ends up giving us 8 qualitatively different ways a word can contribute to the diff between two texts

10/n
There's a lot to unpack here! So to give you practice reading word shift graphs and show you how to use them in practice, we present 5 case studies covering presidential speeches, Moby Dick, U.S. urban parks, 280 character tweets, and labor diversity in the Great Recession

11/n
Word shift graphs are an invaluable tool for unpacking weighted averages and looking at how words affect our measures

We hope this paper can be the ultimate field guide for those are interested in using word shift graphs to help validate their own text-as-data analyses

12/n
All of the word shifts that we mention in the paper are implemented in the Shifterator package
https://t.co/vSL1REYT8V

We have new documentation that includes a comprehensive cookbook for using word shift graphs in Python
https://t.co/p9FdEJYlKN

Please reach out w/ Qs

13/n
I originally presented a draft of this paper at the Text as Data conference in Seattle almost 2 years ago

The Shifterator code has come a long way since then, and I've put a lot of time into it. I hope that people find it useful for their own work
https://t.co/vSL1REYT8V

14/n
Finally, this paper wouldn't have been possible without the hard work of many @compstorylab members past and present

I had a great time collaborating with @mrfrank5790 @lewis_math @andyreagan @ChrisDanforth @peterdodds and Aaron Schwartz on this Story Lab piece!

15/n
In summary: always look at the words!

And please reach out if you have any questions or comments about using word shift graphs!

16/16

More from Data science

✨✨ BIG NEWS: We are hiring!! ✨✨
Amazing Research Software Engineer / Research Data Scientist positions within the @turinghut23 group at the @turinginst, at Standard (permanent) and Junior levels 🤩

👇 Here below a thread on who we are and what we

We are a highly diverse and interdisciplinary group of around 30 research software engineers and data scientists 😎💻 👉
https://t.co/KcSVMb89yx #RSEng

We value expertise across many domains - members of our group have backgrounds in psychology, mathematics, digital humanities, biology, astrophysics and many other areas 🧬📖🧪📈🗺️⚕️🪐
https://t.co/zjoQDGxKHq
/ @DavidBeavan @LivingwMachines

In our everyday job we turn cutting edge research into professionally usable software tools. Check out @evelgab's #LambdaDays 👩‍💻 presentation for some examples:

We create software packages to analyse data in a readable, reliable and reproducible fashion and contribute to the #opensource community, as @drsarahlgibson highlights in her contributions to @mybinderteam and @turingway: https://t.co/pRqXtFpYXq #ResearchSoftwareHour
I have always emphasized on the importance of mathematics in machine learning.

Here is a compilation of resources (books, videos & papers) to get you going.

(Note: It's not an exhaustive list but I have carefully curated it based on my experience and observations)

📘 Mathematics for Machine Learning

by Marc Peter Deisenroth, A. Aldo Faisal, and Cheng Soon Ong

https://t.co/zSpp67kJSg

Note: this is probably the place you want to start. Start slowly and work on some examples. Pay close attention to the notation and get comfortable with it.


📘 Pattern Recognition and Machine Learning

by Christopher Bishop

Note: Prior to the book above, this is the book that I used to recommend to get familiar with math-related concepts used in machine learning. A very solid book in my view and it's heavily referenced in academia.


📘 The Elements of Statistical Learning

by Jerome H. Friedman, Robert Tibshirani, and Trevor Hastie

Mote: machine learning deals with data and in turn uncertainty which is what statistics teach. Get comfortable with topics like estimators, statistical significance,...


📘 Probability Theory: The Logic of Science

by E. T. Jaynes

Note: In machine learning, we are interested in building probabilistic models and thus you will come across concepts from probability theory like conditional probability and different probability distributions.
To my JVM friends looking to explore Machine Learning techniques - you don’t necessarily have to learn Python to do that. There are libraries you can use from the comfort of your JVM environment. 🧵👇

https://t.co/EwwOzgfDca : Deep Learning framework in Java that supports the whole cycle: from data loading and preprocessing to building and tuning a variety deep learning networks.

https://t.co/J4qMzPAZ6u Framework for defining machine learning models, including feature generation and transformations, as directed acyclic graphs (DAGs).

https://t.co/9IgKkSxPCq a machine learning library in Java that provides multi-class classification, regression, clustering, anomaly detection and multi-label classification.

https://t.co/EAqn2YngIE : TensorFlow Java API (experimental)

You May Also Like

THREAD: 12 Things Everyone Should Know About IQ

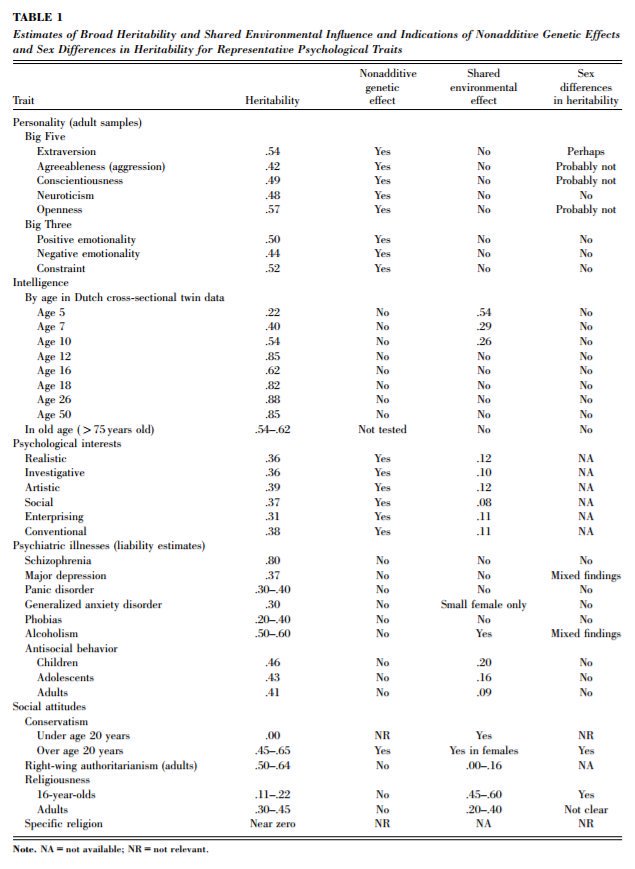
1. IQ is one of the most heritable psychological traits – that is, individual differences in IQ are strongly associated with individual differences in genes (at least in fairly typical modern environments). https://t.co/3XxzW9bxLE


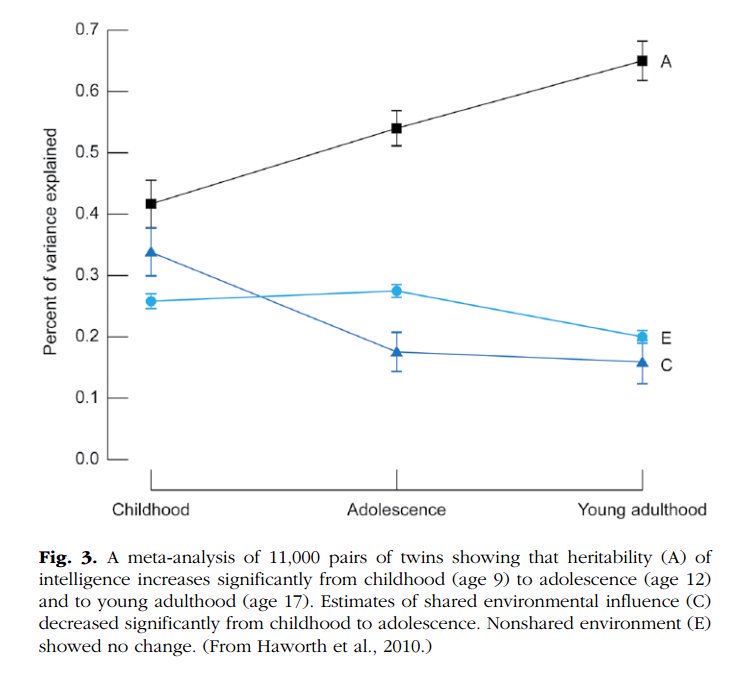
2. The heritability of IQ *increases* from childhood to adulthood. Meanwhile, the effect of the shared environment largely fades away. In other words, when it comes to IQ, nature becomes more important as we get older, nurture less.
https://t.co/UqtS1lpw3n


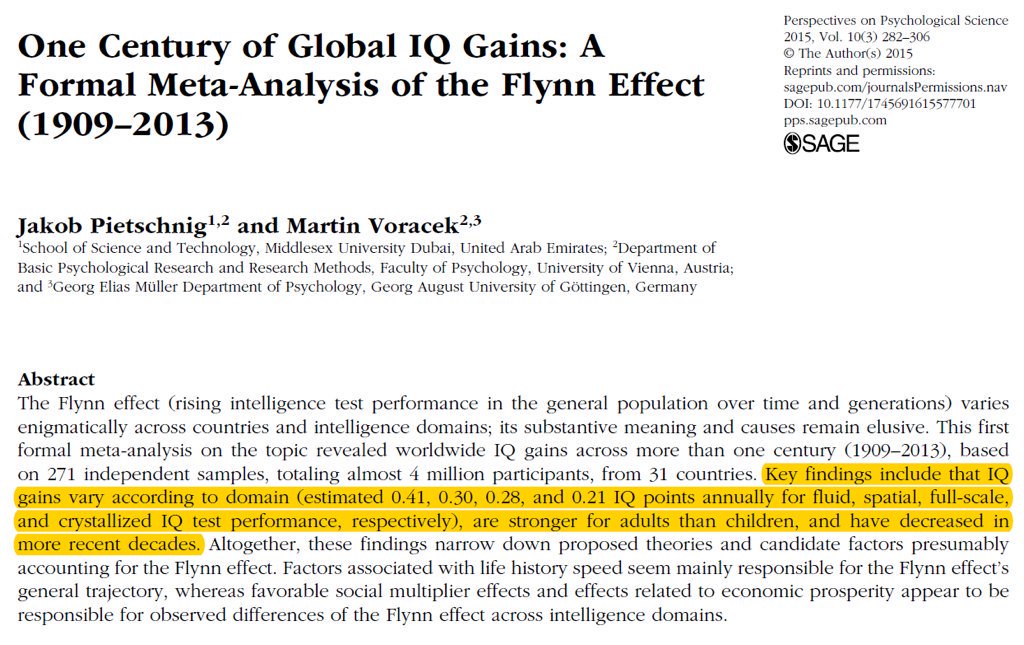
3. IQ scores have been increasing for the last century or so, a phenomenon known as the Flynn effect. https://t.co/sCZvCst3hw (N ≈ 4 million)

(Note that the Flynn effect shows that IQ isn't 100% genetic; it doesn't show that it's 100% environmental.)


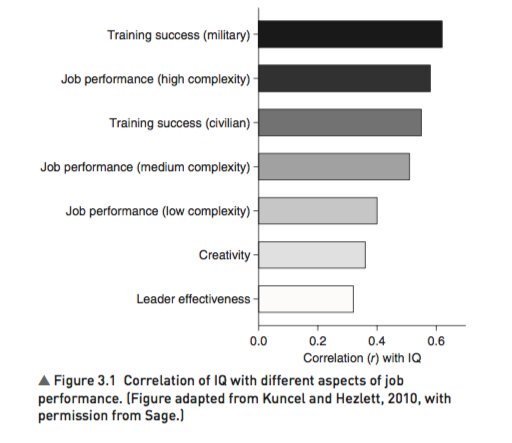
4. IQ predicts many important real world outcomes.

For example, though far from perfect, IQ is the single-best predictor of job performance we have – much better than Emotional Intelligence, the Big Five, Grit, etc. https://t.co/rKUgKDAAVx https://t.co/DWbVI8QSU3


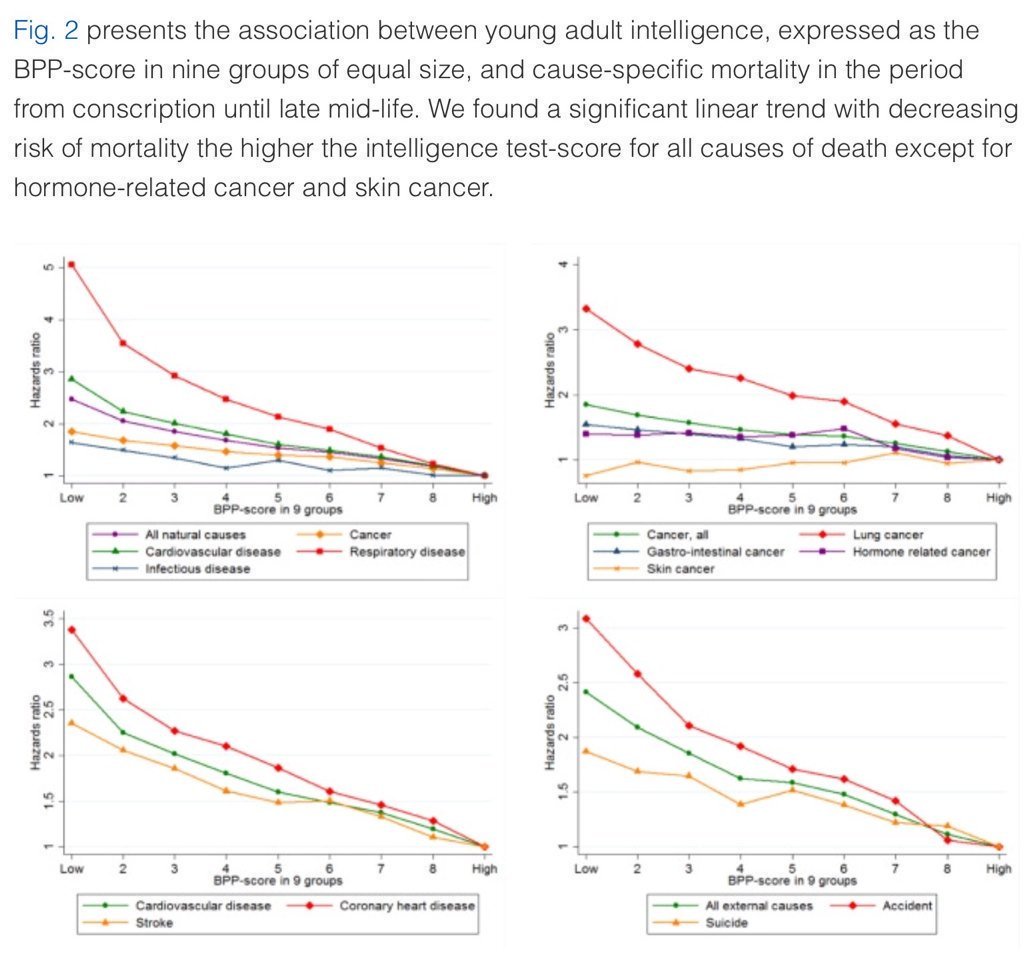
5. Higher IQ is associated with a lower risk of death from most causes, including cardiovascular disease, respiratory disease, most forms of cancer, homicide, suicide, and accident. https://t.co/PJjGNyeQRA (N = 728,160)