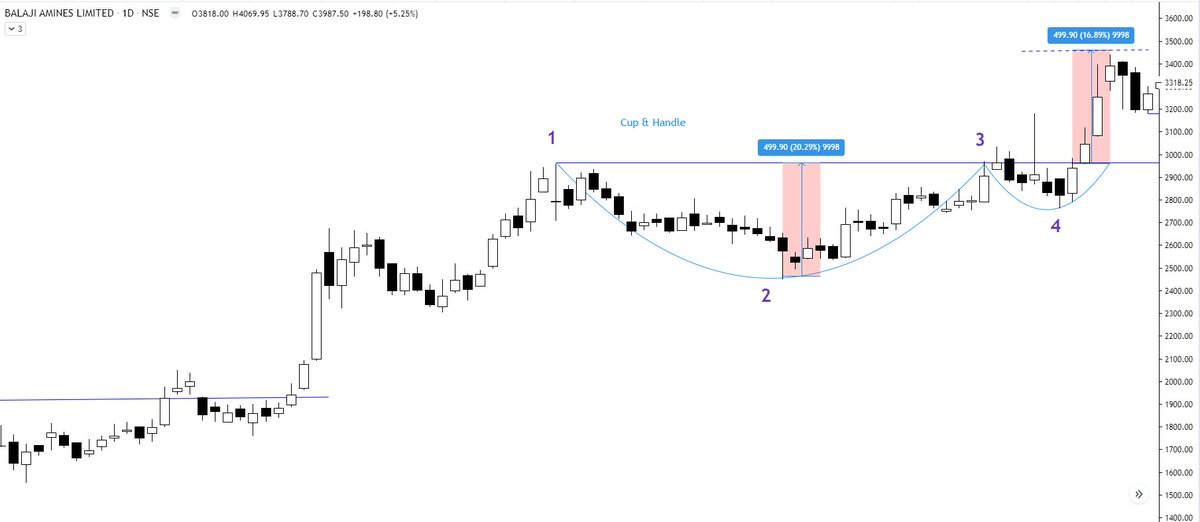
Reminded me of my Borosil renewables chart of last year in July.
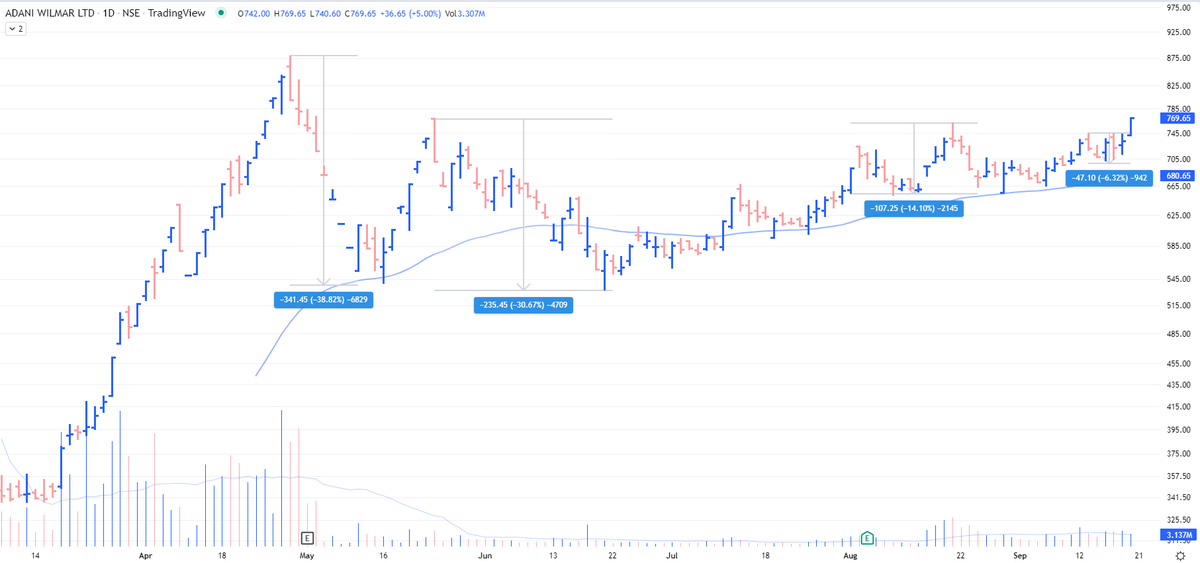
AWL - look at the ranges of contraction on the chart https://t.co/2XMhqZQu8X
Borosil Renewables - Patterns like these must be looked at carefully and must be kept on the radar. Herein price is contracting which generally signifies shifting of hands (from weak to strong). If you go wrong, the risk is limited in these. pic.twitter.com/iqyoeslZjy
— The_Chartist \U0001f4c8 (@charts_zone) July 12, 2021
More from The_Chartist 📈
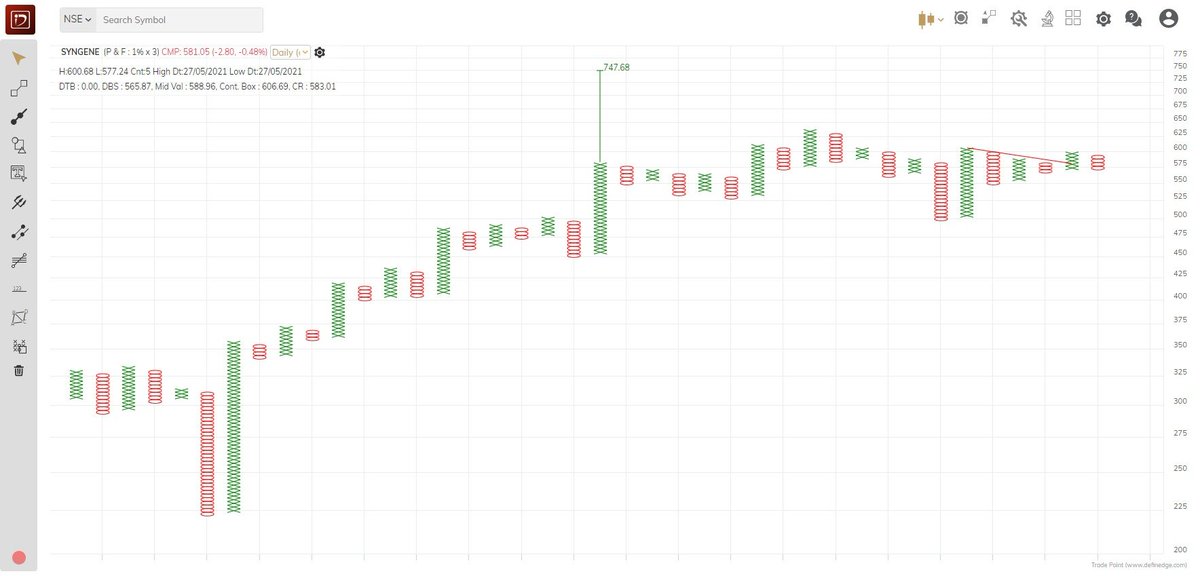
Syngene - Same concept. Price contraction. Shift from weak to strong hands through repeated volatility contractions. I can well write one whole page explanation on it. Look at the volume pump today. A big hand will never let you ride with him. Make sure you are there at the party https://t.co/RN8sQYzdBg pic.twitter.com/AShKWnQeJt
— Steve Nison (@nison_steve) July 15, 2021


Russell 2000
It is better if you spend considerable time learning these concepts. https://t.co/caBHOO4Owa
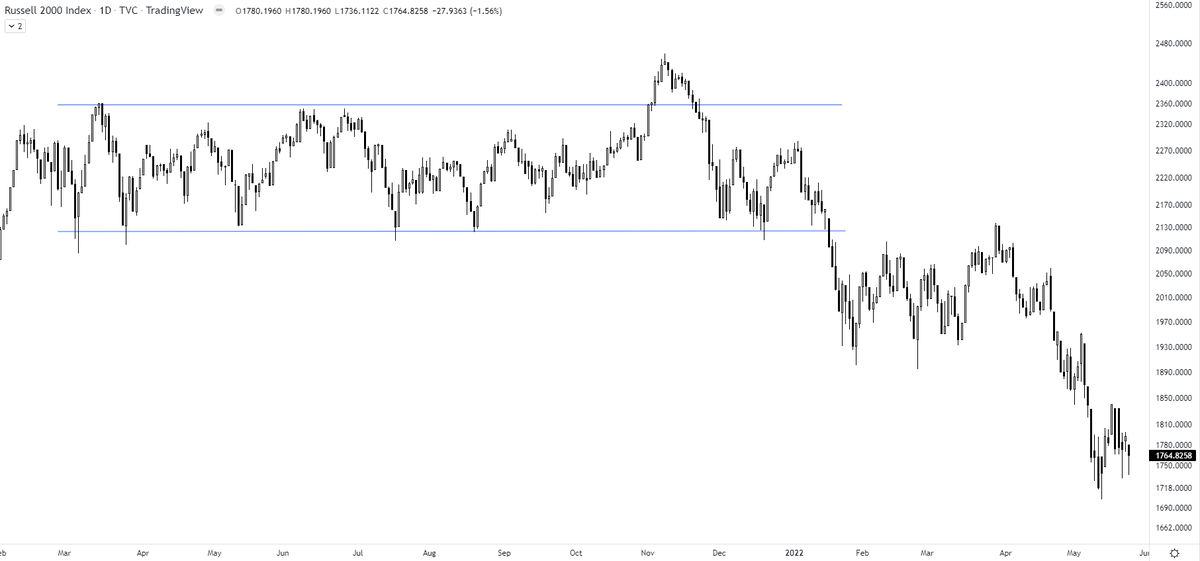
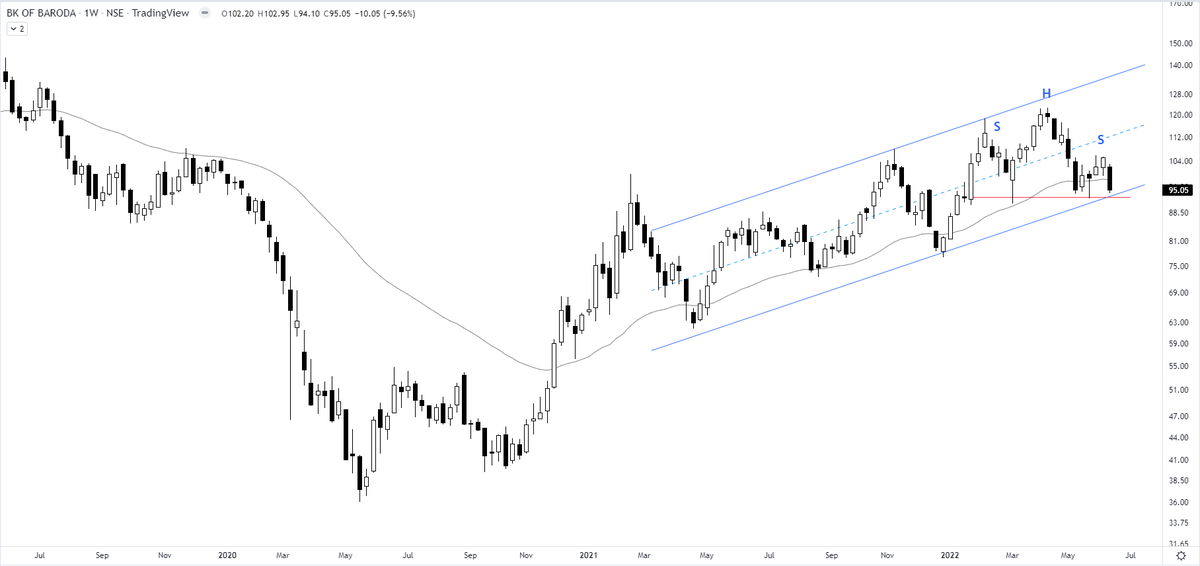
TRAPS? In a false breakout, the price breaks out of the range & comes back within the range. A trap is one step ahead, price not only comes back within the range but breaks down in the opposite direction. It traps the initial longs who didn't close their positions
— The_Chartist \U0001f4c8 (@charts_zone) January 22, 2022
Russell 2000 pic.twitter.com/txzjdnStzc